
SQL Server performance
SQL Server blocking Finding the head blocker
SQL Server blocking happens when one session holds a lock that another session needs. Short waits are normal. When blocking lasts long enough to affect work, find the head blocker, capture its SQL and open transaction, then fix why the wait persisted.
Run this SQL Server blocking query first
Run this read-only query while blocking is still happening. It returns the blocked sessions, every blocker named by those requests, and a likely head blocker. It also keeps sleeping sessions in the result. That matters because a session can finish its last statement, go to sleep, and still hold locks inside an open transaction.
The result is a live snapshot. Run it more than once if the incident is moving, and save each result with the time it was captured. A request that finishes between samples disappears from the DMVs. The query reads normal dynamic management views, but querying a very busy server still has a small cost, so collect what you need and avoid running it in a tight loop.
Returns blocked sessions, participating blockers, a likely head blocker, transaction age, SQL text, and the last submitted command.
Find the SQL Server blocking chain
T-SQL · 117 lines
HEAD BLOCKER means the session blocks another participant and is not itself waiting on a lock in this snapshot. BLOCKED AND BLOCKING is an intermediate session in a longer chain. Negative blocker IDs describe special owners such as orphaned distributed transactions or untracked latch owners; they are explained in special_blocking_owner. last_submitted_command is useful when a blocker is sleeping and has no current request or sql_handle. A null database or current batch is expected for some sleeping sessions; use the host, program, login, input buffer, and transaction details together. SQL Server 2022 and later use VIEW SERVER PERFORMANCE STATE for server-wide DMV visibility. Earlier supported versions generally use VIEW SERVER STATE.
Permission behavior is version-specific. Check Microsoft's current sys.dm_exec_requests documentation before granting diagnostic access.
Download diagnostic scriptUse SSMS to check current SQL Server blocking
SQL Server Management Studio has two useful visual checks. In Object Explorer, right-click the server, then open Reports → Standard Reports → Activity – All Blocking Transactions. The report shows transactions at the head of a blocking chain and lets you expand them to see blocked transactions, the blocking statement, and the blocked statement.
Activity Monitor provides a faster current-state check. Open it from the server in Object Explorer, use the Processes pane, and inspect the Blocked By column. Follow the session IDs until you reach the session at the head of the chain.
Both views describe what is happening now. They cannot reconstruct a chain that cleared before SSMS was opened. Use the DMV query above when you need data that can be saved, compared between samples, or checked for transaction age and sleeping-session input. Microsoft documents both SSMS paths in its SQL Server blocking troubleshooting guide.
How to read the SQL Server blocking chain
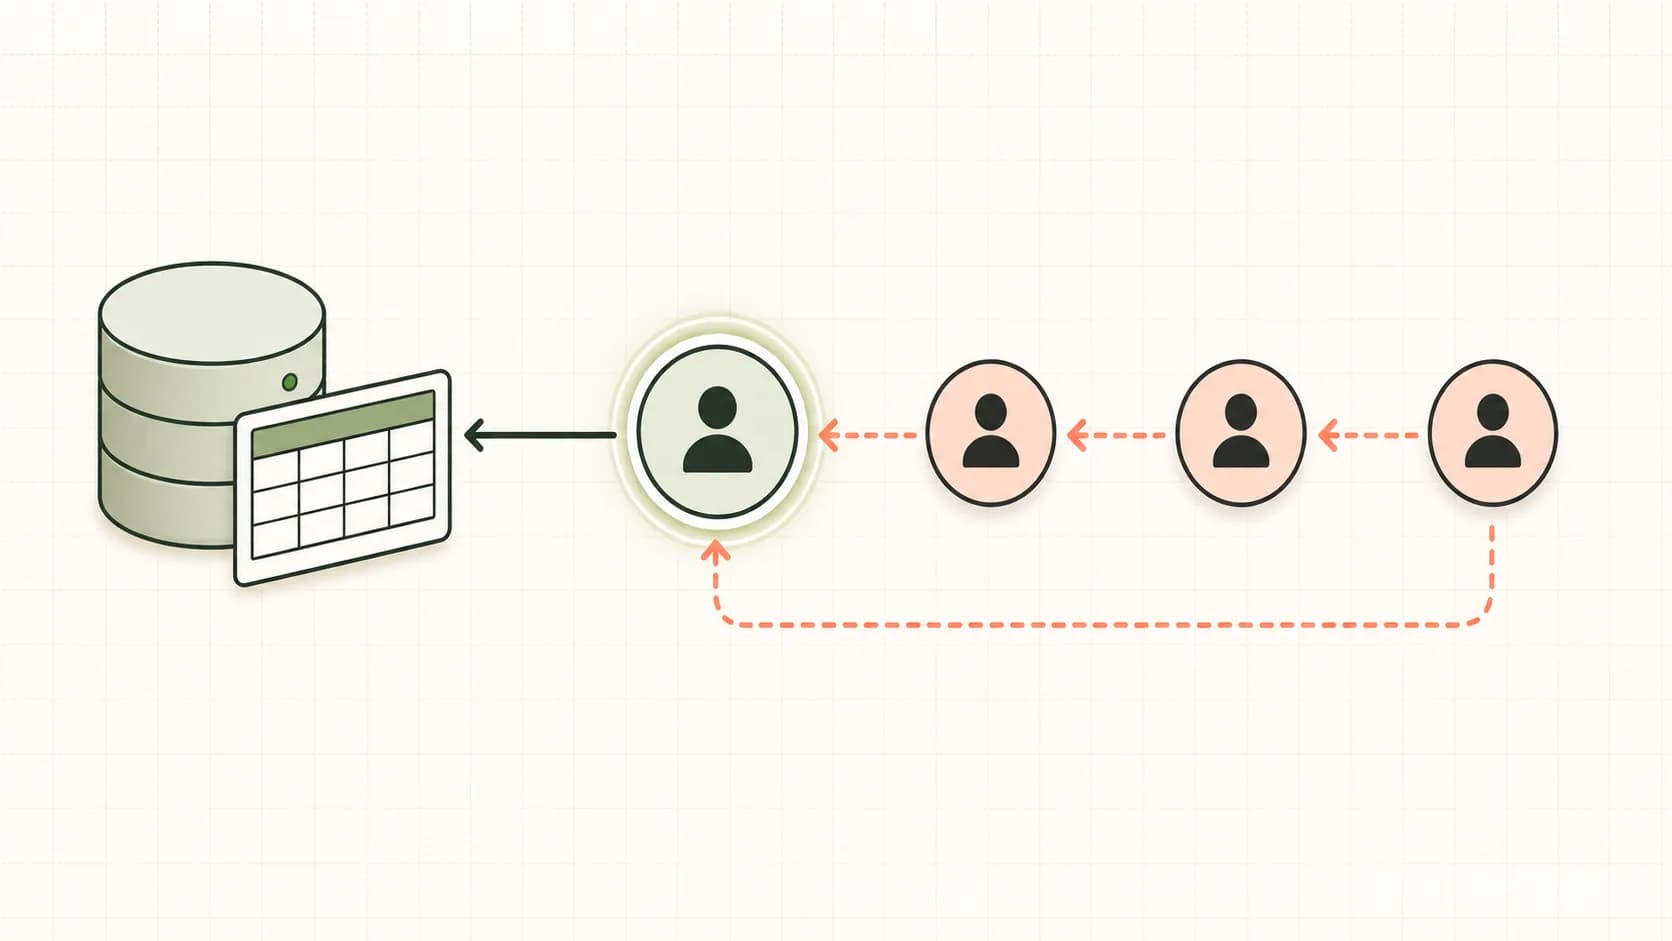
Follow blocking_session_id upward until you reach a session that is blocking others but is not waiting for a lock itself. That is the head blocker for this chain. An intermediate session can be both blocked and blocking: it waits for one lock while sessions below it wait for locks that it already owns.
The session blocking the largest number of requests is the most visible participant, but the chain still needs context. A head blocker may be running a write, sleeping with an uncommitted transaction, rolling back work, or waiting on CPU, storage, memory, or another non-lock resource. Its present statement may also differ from the earlier statement that acquired the locks.
| Output | What it means | What to check next |
|---|---|---|
| blocking_session_id | The immediate blocker for this request. | Follow the ID through the result until the chain reaches its head. |
| HEAD BLOCKER | This session blocks another participant and is not lock-blocked in the snapshot. | Check its SQL, wait, application, and transaction age. |
| LCK_M_* | The request is waiting for a SQL Server lock mode. | Read it with wait_resource, duration, and the blocker. |
| Sleeping + open transaction | The client has no active request but the transaction can still hold locks. | Use the input buffer, host, program, login, and application owner. |
| ROLLBACK | SQL Server is undoing data changes and can hold locks until it finishes. | Check rollback progress and avoid a restart. |
| Long wait_time_ms | The business impact has been building during this sample. | Save the result before intervening and compare another timed sample. |
Check what the head blocker is holding open
Once you have the head-blocker session ID, inspect that session by itself. The transaction start time tells you how long the unit of work has been open. The input buffer shows the last command submitted by a sleeping session. Current SQL and the current plan help when the request is still active.
Treat the plan as one clue. A broad scan, repeated lookup, or bad estimate can make a statement touch more rows and hold locks longer, but one live plan does not describe the full workload. Compare it with normal plans, Query Store history, execution frequency, and write cost before changing an index.
Replace the sample session ID with the head blocker returned by the first query.
Inspect the head blocker
T-SQL · 42 lines
An active long-running write often points to query cost, transaction size, or an unexpected plan. A sleeping session with an old transaction often points to missing commit or rollback handling in the application. The current plan is null when no request is active or the plan is unavailable. Several active transactions can produce more than one row for a session; inspect each transaction ID and start time.
Maintenance, deployments, ETL, and large reports can also head a chain. Match the host and program name with SQL Agent history and the change schedule. If the head blocker is waiting on a non-lock resource, use the SQL Server waits guide to investigate what is preventing it from finishing.
For the full list of lock resources, modes, compatibility rules, and row-versioning behavior, use Microsoft's transaction locking and row versioning guide. During an incident, the chain, transaction age, SQL, and application context are usually more useful than memorizing every lock mode.
How to find the root cause of a blocking incident
Finding the head blocker identifies where to investigate. Root cause needs a connected explanation: which statement held the locks, why the transaction stayed open, why the statement touched those resources, and what changed when the incident started.
| Question | Evidence to collect | What it can show |
|---|---|---|
| What headed the chain? | Active SQL, recent batch, and input buffer | The current request or the last work submitted by a sleeping session. |
| Why were locks still held? | Transaction start time, state, count, and application scope | A long transaction, abandoned transaction, rollback, or work left open around an application call. |
| Why did the statement touch so much data? | Execution plan, actual rows, estimates, Query Store history, and indexes | A scan, plan regression, repeated lookup, stale estimate, or weak access path. |
| Why did it happen at that time? | SQL Agent history, deployments, ETL, reports, maintenance, and traffic | A workload overlap, release, scheduled task, or sudden concurrency change. |
| Does it recur? | Blocked process reports and monitoring history | The same application, table, query, transaction shape, or time window returning. |
| Who owns the fix? | Host, program, login, database, and query source | Whether the next action belongs with the DBA, developer, software vendor, or operations owner. |
The blocked request shows the impact. The head blocker and transaction explain what held the resource. Historical timing explains why the problem returned. Keep those three parts together before choosing a query, application, scheduling, indexing, or isolation change.
Use blocked process reports for intermittent blocking
Live DMV queries cannot reconstruct a blocking incident after the requests finish. When users report frozen screens at 10:00 but the server looks normal at 10:10, capture blocked process reports with Extended Events. Each report records the blocked and blocking process details at the time SQL Server detects the wait.
The server's blocked process threshold controls when reports are produced. It is disabled by default. Microsoft supports values from 5 to 86,400 seconds, and the lock monitor checks on an interval, so reporting is best effort rather than an exact real-time timer. Choose a threshold that represents an actionable delay for this application. A five-second wait may be serious for a checkout transaction and irrelevant for a nightly batch.
- 1Agree on a useful blocking-duration threshold with the application owner.
- 2Review and change blocked process threshold through the normal production change process.
- 3Create an Extended Events session that captures blocked_process_report into an event file.
- 4Set file size, rollover, retention, and storage so the capture cannot grow without control.
- 5Record the event timestamp, database, blocked and blocking process, wait resource, SQL text, host, application, and login.
- 6Compare the events with deployments, SQL Agent jobs, ETL, reporting, maintenance, and user traffic.
Use Extended Events as the default capture method. SQL Trace and Profiler are deprecated and should not become the new monitoring design. Keep the event session narrow, test it outside the busiest period, and confirm that someone will review the data. Capturing files nobody reads only postpones the same incident.
Microsoft documents the timing limits and configuration behavior on the blocked process threshold page. For a broader alerting and retention design, use the SQL Server monitoring guide.
What a SQL Server blocking monitor should capture
A useful blocking alert needs enough data to continue the investigation after the chain clears. Save the full chain, head blocker, blocked duration, wait type and resource, active and recent SQL, transaction age and state, database, application, host, login, capture time, plan or query identifier, and the person or system that received the alert.
“Real time” still depends on collection intervals and alert thresholds. SQL Server's blocked process report is best effort, and the lock monitor checks on an interval with a minimum detectable threshold of five seconds. Set the threshold from application impact, then test that the alert arrives with useful context.
| Monitoring approach | Best fit | What to verify |
|---|---|---|
| Extended Events and blocked process reports | Native capture with no separate monitoring product | Event-file retention, threshold, full XML, alert delivery, and who reads the capture. |
| Self-hosted or open-source monitoring | Companies that can own collectors, storage, upgrades, and alert rules | Blocking-chain depth, query text, history, repository growth, permissions, and maintenance. |
| Dedicated SQL Server monitoring | DBA-led estates that need blocking trees and SQL-specific incident views | Head-blocker detail, historical chains, duration rules, plans, waits, retention, and alert noise. |
| Full-stack database or APM monitoring | Incidents that need database activity beside application traces, hosts, logs, and deployments | SQL depth, query samples, plans, transaction context, retention, and DBA-specific gaps. |
SQL Sentry and Redgate Monitor are examples of dedicated SQL Server monitoring. DBA Dash represents a self-hosted open-source approach. Datadog Database Monitoring represents the full-stack category. These are examples, not a ranking; test each candidate with a safe blocking case and confirm that it preserves the head blocker, blocked statements, time window, and alert context.
SolarWinds documents hierarchical SQL Sentry blocking chains, while Datadog documents its SQL Server Database Monitoring setup and collected query data. Use the SQL Server monitoring tools comparison for the wider current shortlist.
Why SQL Server blocking lasts too long
Blocking becomes harmful when a transaction holds an incompatible lock longer than the workload can tolerate. The durable fix depends on why the lock stayed open. Use the captured session, transaction, SQL, plan, and application details to choose the cause. Avoid starting from a favorite fix such as more hardware, another index, or a different isolation level.
| Observed pattern | Likely cause | Durable response |
|---|---|---|
| Sleeping blocker with an open transaction | The application timed out, cancelled work, or returned a pooled connection without completing the transaction. | Fix commit, rollback, timeout, and error handling. Review SET XACT_ABORT behavior in tested code. |
| Long UPDATE or DELETE | The transaction or batch covers too many rows or stays open around unrelated work. | Shorten the transaction and batch changes where business rules allow it. |
| Scan on a hot table | A poor access path or regressed plan touches too much data while locks are held. | Review the query, estimates, plan history, and workload before changing an index. |
| Blocking matches a job window | Maintenance, ETL, cleanup, or reporting overlaps with user work. | Change timing, batch size, access path, or workload placement. |
| Reader/writer contention | Locking READ COMMITTED behavior makes readers and writers wait on incompatible locks. | Test RCSI semantics, application behavior, and tempdb capacity before changing the database option. |
| Schema lock | DDL, compilation, index work, or another metadata change needs a schema lock. | Change deployment or maintenance design and timing. |
| Blocker is rolling back | A modification was killed, cancelled, or disconnected and SQL Server is undoing it. | Allow rollback to finish and monitor progress. Reduce future transaction size. |
| Client stops fetching rows | The application leaves a server result pending while locks remain relevant. | Fix result consumption, connection handling, and query shape. |
| Lock escalation event | A statement acquired a large lock footprint or the server reached lock-memory pressure. | Reduce touched rows and transaction size or improve the access path before considering escalation controls. |
Transaction scope is often the useful boundary. Open the transaction immediately before the work that must be atomic, complete that work, and commit or roll back before calling another service, waiting for user input, or doing unrelated processing. Application timeout handling must also close the transaction deliberately; cancelling the current query does not give SQL Server enough information to commit the business action.
Indexing helps when the captured plan reads far more rows than the request needs. Use the SQL Server indexing guide to compare usage, overlap, write cost, and plan behavior. Microsoft's blocking troubleshooting guide covers application-side cases, while its lock escalation guidance explains escalation thresholds and safer preventive work.
Before you kill the blocking session
Ending a session can release locks, but SQL Server must roll back its uncommitted changes. A large update may take a long time to undo and can keep locks during rollback. First decide whether leaving the transaction running causes more harm than ending it, and make that decision with the owner of the business process when possible.
- 1Save the blocking chain, SQL text, transaction age, application, login, database, and capture time.
- 2Identify the business process and confirm whether the session is running, sleeping, or rolling back.
- 3Check deployment, maintenance, SQL Agent, HA, and batch context before treating the session as stray work.
- 4Estimate rollback impact from the transaction size and work already completed.
- 5End the session only when the operational impact is understood and the safer response is clear.
- 6Keep the capture and use it to make the permanent query, transaction, application, or scheduling fix.
A server restart does not make an unfinished transaction disappear. Recovery still has to bring the database to a consistent state, and the database can remain unavailable while that happens. Monitor a rollback instead of repeatedly killing the session or restarting the instance.
NOLOCK allows dirty and inconsistent reads, so it is not a correctness-safe blocking fix. An isolation change affects the database's concurrency and version-store behavior. Disabling lock escalation can create lock-memory pressure. Rebuilding indexes during the incident can add more work and locks. Each of these changes needs diagnosis, testing, and a rollback plan.
Prevent the same blocking chain from returning
Prevention starts with the cause found in the capture. Apply the smallest change that shortens the harmful wait while preserving correct transaction behavior.
- Begin transactions immediately before the work that must be atomic and keep them short.
- Commit or roll back on every application success, error, timeout, and cancellation path.
- Keep remote calls, user input, and unrelated processing outside the transaction.
- Tune the captured plan against Query Store history and the full workload, not one snapshot.
- Batch large modifications where business rules and recovery behavior allow it.
- Separate heavy reports, ETL, cleanup, and maintenance from busy OLTP windows.
- Test RCSI semantics and tempdb capacity before changing database isolation behavior.
- Alert on a blocking duration tied to user impact instead of every short lock wait.
- Retain enough blocking history to compare repeat incidents and verify the fix.
Read committed snapshot isolation can reduce reader-writer blocking by serving committed row versions. It changes tempdb use and read behavior, and it does not remove write-write or schema blocking. Test the application's assumptions and monitor the version store; the tempdb guide covers the capacity checks.
SQL Server 2025 adds optional optimized locking for user databases. It can reduce lock memory, lock escalation, and some blocking patterns. It requires accelerated database recovery, and its lock-after-qualification benefit uses RCSI. It remains a database design choice rather than a replacement for query and transaction analysis. Check Microsoft's current optimized locking documentation before evaluating it.
SQL Server blocking and deadlocks need different captures
Blocking is normally a one-way wait or a chain: one session holds a resource and another waits. The wait can continue until the blocker finishes, rolls back, disconnects, or is ended. SQL Server does not raise an error simply because ordinary blocking lasts a long time.
A deadlock is a cycle in which sessions wait on resources held by each other. SQL Server detects the cycle, chooses a victim, rolls it back, and returns error 1205. Use blocking-chain and blocked-process data for blocking. Use the deadlock XML graph to inspect a deadlock. The deadlock on SQL Server guide shows that separate workflow, and the error 1205 reference gives the compact first check.
SQL Server blocking FAQ
Can SQL Server show blocking that happened yesterday?
Live DMVs cannot reconstruct a finished incident. You need an existing Extended Events capture, blocked process reports, monitoring history, or another collector that saved the session and query details at the time.
Does READ COMMITTED SNAPSHOT remove all blocking?
RCSI reduces common reader-writer blocking under READ COMMITTED. Writers can still block writers, schema locks still apply, and explicit locking hints or higher isolation levels can keep lock-based behavior.
Is SSMS enough to monitor SQL Server blocking?
SSMS is useful for a current visual check. Activity Monitor and the standard blocking report cannot reconstruct a chain that has already cleared, so recurring incidents need Extended Events, blocked process reports, or another collector with history.
What tools can send real-time SQL Server blocking alerts?
Native Extended Events, self-hosted collectors, dedicated SQL Server monitors, and full-stack database monitoring platforms can all drive alerts. Choose by the chain detail, history, retention, and alert routing you need; use the monitoring tools comparison for current product options.
When should I bring in a SQL Server blocking specialist?
Bring in specialist help when blocking repeatedly affects users, the head blocker remains unclear, ending a production session has uncertain rollback impact, or the available captures do not connect the chain to a safe permanent fix.
Reach out for help on solving performance issues
My SQL Server consulting services include help with recurring blocking and other performance issues. Tell me what users are seeing and when it happens, and I will work out the next useful check from there.
Request a performance reviewNext step
If the symptom is general slowness and blocking is still unconfirmed, use the SQL Server performance issues guide.
For recurring incidents, continue with the monitoring guide and keep the blocking capture narrow enough that someone can review it.