
How SQL Server Query Store helps find query regressions
Query Store records plan and runtime changes across deployments, maintenance windows and recurring performance issues. Execution counts help distinguish higher workload volume from increased cost per execution. Its retained history can remain available after corresponding plans have left the cache.
Runtime metrics are aggregated into intervals rather than recorded as an exact replay of application requests. Capture policy, retention and collection state determine which queries and periods are available. Average duration describes the captured executions as a group, not each individual request.
Query Store was introduced in SQL Server 2016. Collection is disabled by default for SQL Server 2016–2019 databases and enabled in read-write mode for newly created databases from SQL Server 2022. Existing and restored databases retain settings that require individual inspection. See Microsoft's Query Store overview.
| SQL Server release | Query Store scope to check |
|---|---|
| 2016–2019 | Inspect each database; collection is not enabled by default. |
| 2017 and later | Query Store wait statistics are available alongside runtime metrics. |
| 2019 and later | CUSTOM capture policies can set capture thresholds. |
| 2022 and later | Newly created databases enable collection by default. Verify restored and existing databases separately. |
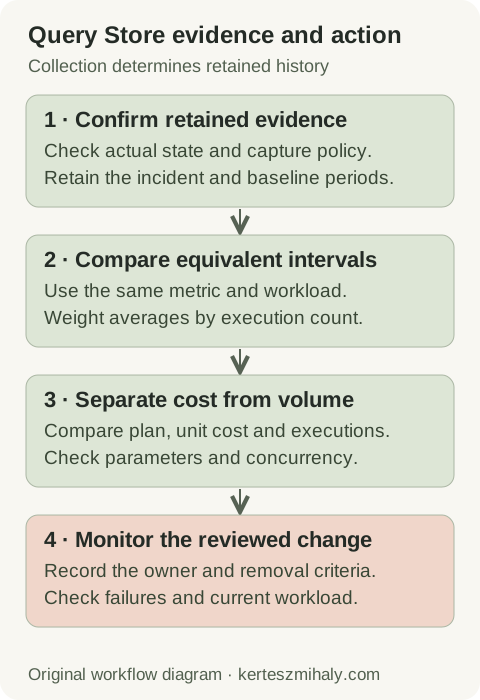
A baseline must be captured before the change being investigated. Its duration should include the normal workload cycle: a week may cover weekly processing, whereas monthly batches need a longer period. Collection enabled after an incident cannot recover earlier uncaptured statistics.
Query Store collection state and read-only reasons
Read Query Store collection and retention settings
T-SQL · 9 lines
Replace the database name; the view is database-scoped. SQL Server 2016–2019 require VIEW DATABASE STATE. For SQL Server 2022 and later, Microsoft specifies VIEW DATABASE PERFORMANCE STATE; VIEW DATABASE STATE also permits access. See the Query Store options reference.
The desired state records the requested configuration; the actual state identifies current collection behavior. readonly_reason is a bitmap that can contain several reasons. Bit 65536 indicates the storage quota, while other bits represent database state or internal memory constraints.
Record collection gaps alongside the incident window. A gap explains missing statistics without describing workload behavior during that period. Secondary-replica collection also depends on version-specific functionality and may differ from collection on the primary.
Configure Query Store capture, retention and maximum size
This changes database configuration. Confirm database, engine build, storage headroom and change ownership first.
Configuration change · enable Query Store on a reviewed database
T-SQL · 2 lines
On older releases, check the servicing level before enabling Query Store. Apply configuration per database and monitor the application afterward. Retained records use space in the user database. Query Store is unavailable for master and tempdb.
Choose capture policy, retention, aggregation intervals and storage limits for the investigation period. AUTO applies capture thresholds and can omit infrequent or low-cost queries. ALL captures more queries and can grow quickly with many distinct ad hoc statements. SQL Server 2019 introduced CUSTOM policies for configuring capture thresholds explicitly.
Microsoft's Query Store management guidance describes these controls. Measured growth and the required comparison period determine storage and retention settings. The retained history should include both the baseline and changed workload.
Capture mode NONE stops adding new queries while previously captured queries can continue accumulating statistics. Record the mode with exported results, because new SQL text may be absent even while existing queries are still being measured.
Monitor actual state and size together. Retain the relevant query, plan and runtime statistics before changing cleanup settings. Clearing Query Store removes query-related records, including forcing-related data, so existing forced plans also require review. Microsoft documents the CLEAR option. Capture or retention adjustments may address collection problems without a reset.
Compare Query Store plans before and after a performance change
In SSMS Object Explorer, expand Databases → the affected database → Query Store. Regressed Queries and Top Resource Consuming Queries provide an investigation starting point. Select the time window and check collection state, capture policy and retention if the expected query is missing. See Microsoft's tuning walkthrough.
Choose the metric corresponding to the symptom: duration for response time, CPU for processor use, or reads for access cost. Compare query and plan IDs, execution counts and intervals together.
| Observation | Next question |
|---|---|
| Average duration increased with a different plan | Did parameters, data distribution, statistics or indexes also change? |
| Total CPU increased but per-execution CPU stayed similar | Did execution volume or retry behavior increase? |
| One plan has highly variable duration | Is the variation tied to parameters, blocking or different workload periods? |
| Metrics are flat while users report timeouts | Are aborted executions, uncaptured work or application delays being excluded? |
Compare parameter values, execution count and concurrency as well as plan changes. Different workload periods can produce different metrics for the same query text, even without a regression.
Stored plans describe the compiled execution strategy. They do not contain observed row counts for every historical execution. An actual-plan capture is required for those details. Query text and plans may reveal schema or business logic and should remain in authorized diagnostic channels.
Read Query Store runtime statistics with execution-weighted averages
Top retained CPU consumers in complete intervals from the last day
T-SQL · 16 lines
Run this read-only query in the affected database. It includes regular completed executions from complete intervals wholly within the selected window. Active intervals and boundary overlaps are excluded. Aborted and exception executions require separate inspection when investigating failures.
The runtime catalog reports CPU and duration in microseconds. Weight interval averages by execution count before combining them. Adding row-level weighted totals also handles separate in-memory and persisted rows. Runtime statistics definitions.
Parallel queries accumulate CPU across workers, so CPU time and elapsed time measure different quantities. Compare total CPU with CPU per execution to distinguish frequently executed queries from individually expensive queries.
Long aggregation intervals can conceal brief incidents. Align timestamps and time zones with application logs. Request-level timing and parameter values require application logging or a scoped diagnostic capture.
Query Store plan forcing and removal
A previously successful plan may provide temporary mitigation for a measured regression. Verify the query and plan in the affected database, then test representative parameter ranges and current workload conditions. A low average from an unrelated interval is not sufficient for comparison.
Use SSMS or sys.sp_query_store_force_plan through the authorized change process. Forcing or unforcing a plan requires ALTER permission on the database. Record database, query ID, plan ID, baseline window, reason, owner and review date. Plan-forcing procedure.
Inspect forced plans and forcing failures
T-SQL · 4 lines
Plan forcing requests the selected plan, but changes to schema, indexes or data can prevent forcing or reduce its effectiveness. Inspect forcing failure metadata and application performance after the change.
Remove forcing for the specified query and plan through SSMS or sys.sp_query_store_unforce_plan, then check the resulting behavior. Microsoft describes the unforce procedure. Statistics, indexing or application changes may still require separate resolution.
Monitor Query Store storage, capture and plan forcing failures
Periodic review includes collection state, retained intervals and forced plans. Record deployment and configuration times for later comparisons. Temporary forces need a responsible administrator and review date; removal should be tested against the current workload.
The wait-statistics guide and performance diagnosis guide cover current resource pressure and contention. Query Store wait categories are available from SQL Server 2017, while a live blocking chain requires current session diagnostics.
A remote SQL Server performance review can assess retained plans, workload periods and application symptoms. Retain the relevant history before collection resets or cache changes.
SQL Server Query Store questions
Why is Query Store read-only when I requested read-write?
Inspect actual_state_desc and readonly_reason in the affected database. The reason is a bitmap; storage quota is one possible bit, not the only cause. Record collection gaps before changing capacity or retention.
Is Query Store enabled after upgrading to SQL Server 2022?
Newly created databases enable Query Store by default from SQL Server 2022. Existing and restored databases require inspection of their collection settings and retained history.
Should I clear Query Store to fix a regression?
Clearing removes query, plan and runtime history, including forcing-related records. Collection settings and existing forces should be assessed before a reset. Keeping the incident history supports comparison of plans and workload changes.