

Confirm SQL Server high CPU usage at the host and process level
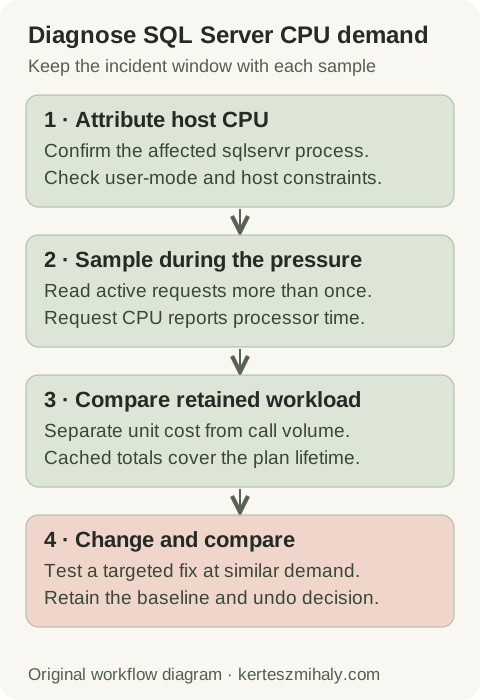
Record the affected instance, application symptoms, start time and duration. Compare host CPU with the process belonging to the instance. Brief maintenance peaks may be expected; sustained pressure combined with longer response times requires further investigation.
On Windows, Task Manager and Performance Monitor identify CPU use by sqlservr.exe. Counter definitions matter: some process counters sum time across logical processors and can exceed 100 percent, while dashboards may normalize the result.
Compare user-mode and privileged-mode activity. High privileged-mode activity may require investigation of drivers or the operating system. For virtual machines, inspect platform CPU availability and contention alongside guest measurements; additional virtual CPUs may not increase available host capacity.
Microsoft's high-CPU troubleshooting guide starts with process identification. Retain request and cache statistics before an instance restart, which removes diagnostic state and can leave the underlying workload unchanged.
Find active SQL Server requests using CPU
Read current user requests by accumulated request CPU
T-SQL · 15 lines
The query is a read-only request snapshot. CPU and elapsed values are cumulative milliseconds for each request, rather than percentages. Viewing other sessions normally requires VIEW SERVER STATE through SQL Server 2019 or VIEW SERVER PERFORMANCE STATE from 2022. See the request DMV definitions and permissions.
Compare several samples for the same session and request during the incident. A request may have accumulated CPU before its current wait. For parallel row-mode requests, the DMV reports the coordinator; its reads and wait fields do not describe every worker. Requests that finish between samples cannot be compared with new requests appearing under a reused identifier.
Short, frequent queries may finish between snapshots. If the live list misses the workload, use retained history and application request volume. Query text can contain sensitive literals; keep captured statements in the authorized investigation and sanitize them before sharing.
High elapsed time with little additional CPU can indicate waiting. Parallel workers can accumulate combined CPU exceeding wall-clock duration. The wait-statistics guide and blocking guide cover contention diagnostics.
Find CPU-heavy cached queries and compare Query Store history
Rank completed cached statements by cumulative CPU
T-SQL · 12 lines
The cache DMV reports completed executions for retained plans. Worker time is in microseconds with millisecond accuracy; the example converts it to milliseconds. Accumulation periods differ, and rows disappear on plan eviction. A lifetime total is therefore distinct from CPU used during the incident. See the query-statistics DMV reference.
Creation and last-execution timestamps describe the retained row. Filtering by last execution leaves earlier executions in its cumulative total. Time-window comparisons require interval history or comparable captured deltas.
The Query Store guide describes interval-based comparisons when collection is available. Compare the baseline and incident periods using execution count and weighted CPU per execution. Retain both periods and the relevant plans before changes.
Separate high query CPU from workload volume and retries
| Observation | Likely investigation | Acceptance measure |
|---|---|---|
| Reads and CPU per execution increased | Plan, predicates, statistics and index access | Representative executions use less CPU and reads |
| Execution count rose; unit cost stayed similar | Traffic, polling, retries and batch schedule | Required work finishes with lower avoidable volume |
| Many new SQL texts and compilation pressure | Parameterization, plan reuse and recompilation | Compilation work falls without a worse execution plan |
| SQL workload does not explain host pressure | Other processes, platform constraints and diagnostic overhead | The responsible resource demand is resolved |
Compare query cost and call volume with the same time window
This arithmetic example uses illustrative values, not a benchmark. Total query CPU is average CPU per execution multiplied by execution count for comparable intervals.
| Case | CPU per execution | Executions | Total CPU |
|---|---|---|---|
| Baseline | 20 ms | 1,000 | 20 seconds |
| More calls, same unit cost | 20 ms | 4,000 | 80 seconds |
| Higher unit cost, same calls | 80 ms | 1,000 | 80 seconds |
Both changed cases consume four times the query CPU, but the next investigation differs. Inspect traffic and retries in the second case; inspect plan and access cost in the third. These totals are not host CPU percentages and do not include uncaptured work.
A scan can be appropriate when a query returns a large portion of a table. Compare rows read with rows required, estimates, predicates and repeated work. Sorts, hashes and calculations may use substantial CPU even with few physical reads.
Correlate imports, index maintenance and reporting refreshes with the CPU window. Overlapping schedules can increase simultaneous demand. Rescheduling nonessential work may reduce pressure while query changes are tested; record the revised completion requirements.
Application retries can increase demand when earlier requests are still running. Compare request volume, timeouts and repeated executions. Any retry-policy change must retain the application's correctness and recovery behavior.
Review execution plans, statistics, indexes and parameter sensitivity
Inspect the relevant plan and representative parameters for unnecessary reads, implicit conversions, access predicates, estimates and repeated operations. A rewrite must preserve results, including date boundaries and null handling, while reducing the measured cost.
When estimates suggest a statistics problem, inspect the relevant statistics and data changes. Targeted updates can be tested with sampling and timing appropriate to the workload. Broad updates add work and can trigger recompilation. See the statistics update guidance.
Missing-index suggestions are candidates for testing. Compare existing indexes, key order, included columns, write overhead and storage, then consolidate overlapping proposals. See Microsoft's missing-index guidance.
For parameter-dependent performance, compare values with different selectivity. SQL Server 2022 introduced Parameter Sensitive Plan optimization at compatibility level 160 for eligible queries; later releases extend it. Check compatibility level, the PSP database-scoped setting, eligibility and generated variants to determine whether it applies. See the PSP reference.
Recompilation, plan forcing and code changes have different costs. Recompilation can improve execution while adding compilation work. A forced plan may improve one parameter range and worsen another. Record the tested workload and procedure for reversing the intervention.
Contain SQL Server CPU pressure with targeted changes
Clearing the whole plan cache removes cached diagnostics and can cause widespread compilation. Capture relevant plans and statistics first. A scoped intervention provides a more limited test when a particular plan is implicated.
Instance-wide MAXDOP and cost-threshold changes affect queries beyond the one being investigated. Parallelism may increase concurrent CPU use while reducing elapsed time. The performance diagnosis guide covers instance topology and workload considerations.
Limit diagnostic capture to the relevant queries and interval to control overhead. Suspected internal contention, non-yielding errors or unexplained process CPU require the engine build, timestamps and targeted diagnostic output for escalation.
Capacity expansion is appropriate when measured workload demand exceeds available resources after relevant query and scheduling issues have been assessed. Include licensing, platform limits and expected demand in the capacity calculation and validation.
Verify the CPU improvement under comparable workload
Compare CPU per execution, execution count, total CPU, response time and throughput at similar parameter distributions and concurrency. Include a representative peak and any added write, memory or storage costs. Host CPU after a batch ends represents a different workload period.
Retain the process measurements, workload interval, dominant queries or traffic change, intervention and before/after results. Monitoring can then target the pattern identified in the incident.
Validation also covers insert and update overhead from added indexes and less frequent parameter values for rewritten queries. Define the comparison period before rollout so the results include representative activity.
A remote SQL Server performance review is available for independent analysis of CPU use and plan changes. Useful inputs include the affected interval, query plans and statistics, request volume and application symptoms.
SQL Server high CPU questions
Which SQL Server query is using CPU right now?
The request DMV example ranks active user requests by accumulated CPU. Repeated samples identify increases for the same request. Short executions may finish between samples and require retained statistics or application request counts.
Why can SQL query CPU time exceed elapsed time?
Parallel workers can consume processor time concurrently. Their combined CPU time can exceed wall-clock duration. Neither value alone is a host CPU percentage.
Should I restart SQL Server when CPU reaches 100 percent?
A restart can remove active-request and cached statistics and add compilation demand. First identify the process using CPU and collect the relevant workload measurements. The incident response then depends on application impact and the diagnosed cause.