

SQL Server capacity planning starts by identifying what can run out. A database file may have free space inside it while the volume holding it has little room to grow. In Azure SQL the next constraint may be a service limit. CPU and I/O need a different view that considers concurrency, workload patterns and how much headroom remains during a busy period.
Some monitors forecast a date when disk use will cross a threshold. Others show database and transaction log growth so a DBA can decide whether the trend is reliable. Cloud monitoring can put those numbers next to service limits and resource metrics. A useful forecast explains which metric it projects and how migrations, seasonal load or a one-time purge changed its history.
SQL Server capacity planning tools at a glance
Start with the metric that can run out. Used pages, allocated file space, free volume capacity and a cloud service limit represent different constraints.
| Tool | Useful evidence | Planning workflow | Verify before buying |
|---|---|---|---|
| Redgate Monitor | Database growth and disk usage in the monitored estate | Review past growth and use the relevant disk forecast or alert | Host and platform metrics, retention, current commercial plan |
| SolarWinds SQL Sentry | Historical disk and SQL Server growth data | Use forecasting reports and verify selected resource and interval | Supported platform and installed SQL Sentry entitlement |
| IDERA SQL Diagnostic Manager | Documented disk-size and instance information | Compare the disk details with the configured capacity reports and alerts | Which SQL and OS metrics actually reach the installed edition |
| Quest Foglight for SQL Server | Database and host storage views | Use retained SQL Server evidence with the planned Foglight reporting workflow | Cartridge, host scope and licensed metrics |
| dbWatch Control Center | Database-growth detail collected by jobs | Gather consistent trends across instances and review thresholds | Job sampling, excluded databases and reporting entitlement |
| Datadog | Selected SQL Server or host metrics with volume tags | Forecast monitor for the metric and window you configure | Collector, billing unit and a way to flag migrations or step changes |
| ManageEngine Applications Manager | Historical monitored resource data | Build an applicable forecast report and check data coverage | SQL Server and host monitors, reporting cadence and edition |
| Azure Monitor | Azure SQL Database resource metrics and service limits | Set metric alerts and export history for planning where needed | Service tier, quota metrics, retention and alert charges |
Redgate Monitor
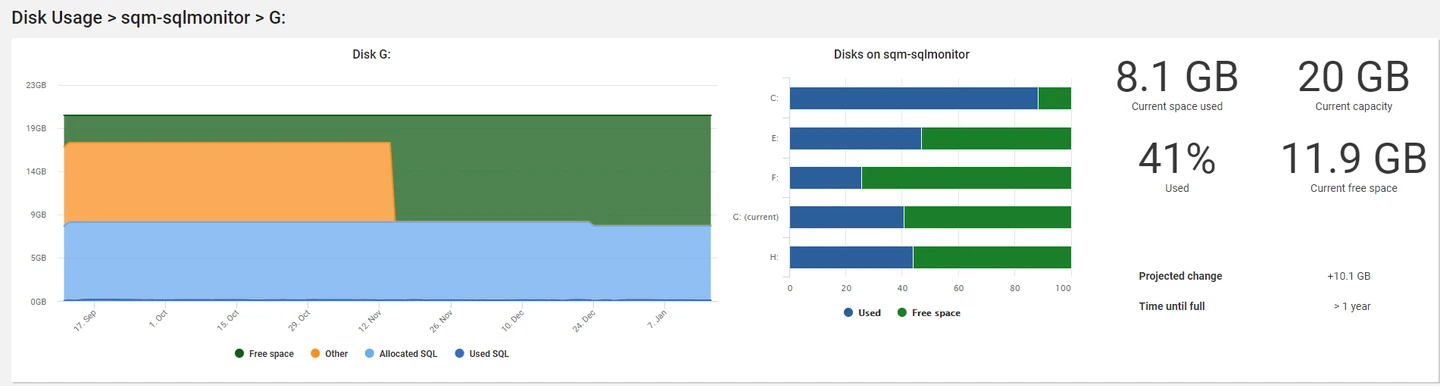
Redgate Monitor tracks free disk space and SQL Server database growth over time. Its estate views help locate the volumes and databases whose usage is increasing. This is useful when a DBA needs to connect a declining storage trend with the databases that may be driving it.
The benefit is seeing the storage and database sides of a capacity question together. A preallocated file can grow in used space without consuming new volume space until the next expansion. The forecast’s usefulness depends on retention and whether the observed growth period reflects the planned workload.
Use the database-growth and disk-space views together. Locate the file on the affected volume and check whether a step in allocated size is a data growth problem or another file consuming the same storage. Record both series at the same time.
Test the alert against a known free-space requirement on that volume and validate the forecast horizon after a lab change. Check whether a separate host collector or entitlement is required for the deployment you monitor.
- Compatibility
- Redgate Monitor with supported SQL Server and host monitoring. Available metrics depend on the deployment.
- License and trial
- Commercial monitoring license.
SolarWinds SQL Sentry
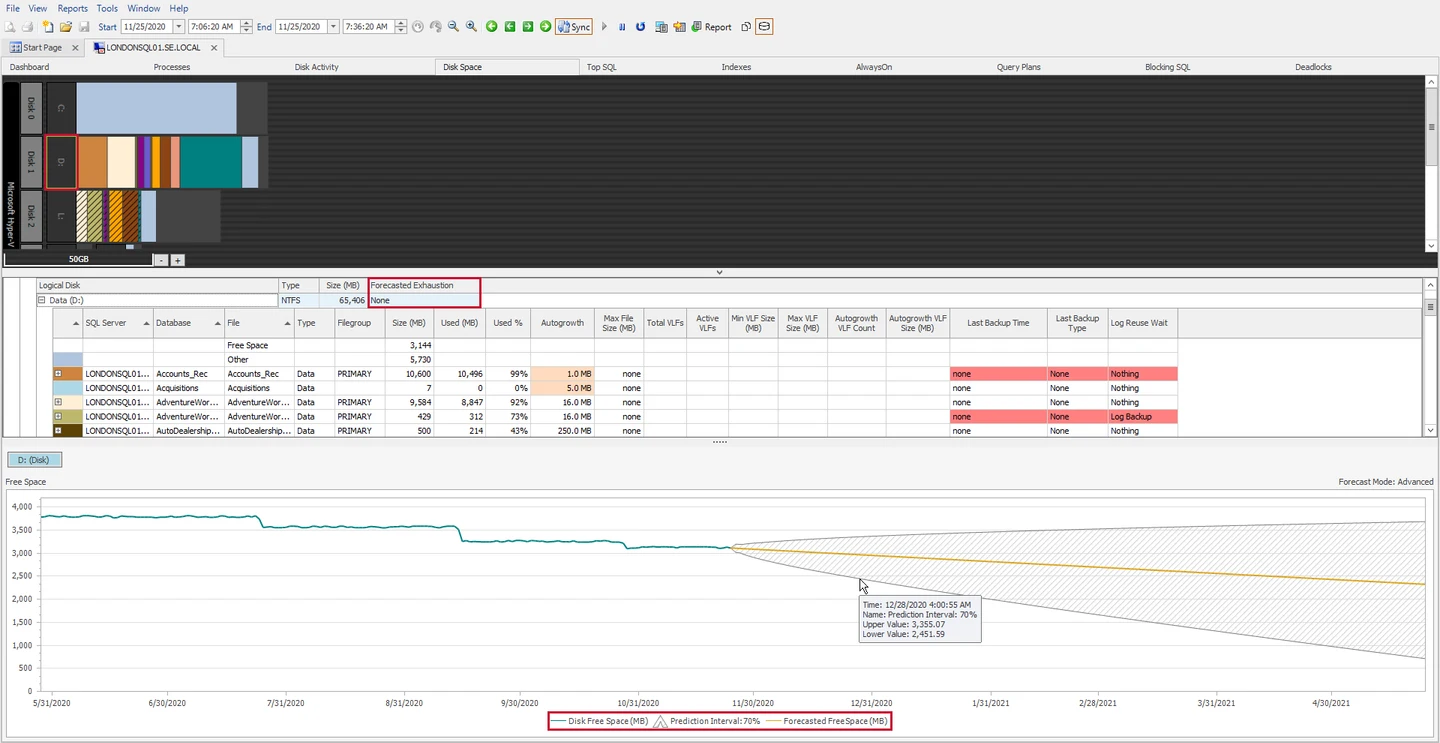
SQL Sentry Disk Forecasting projects volume usage from collected SQL Server host data. Its Standard model uses a form of linear regression that can account for some abrupt manual changes. It is useful when the team needs a forward view of which monitored disks are likely to run out of space.
Its strongest fit is storage planning for an estate already in SQL Sentry. The forecast relies on enough representative history. SolarWinds documents additional, older prerequisites for its Advanced model and notes their retirement, making the available forecast mode a practical part of the product decision.
Run the capacity report for the same disk and database inventory you use in the native measurements. Save the date range and selected metric so the projected value can be traced to the data that produced it.
Introduce a controlled new allocation in the storage model. Check how the forecast reacts when you choose a window containing the discontinuity. Compare the warning time with the actual free space and the next file growth increment.
- Compatibility
- SQL Sentry repository and a monitored storage source. Standard and legacy Advanced modes have different prerequisites.
- License and trial
- Commercial SolarWinds SQL Sentry licensing.
IDERA SQL Diagnostic Manager
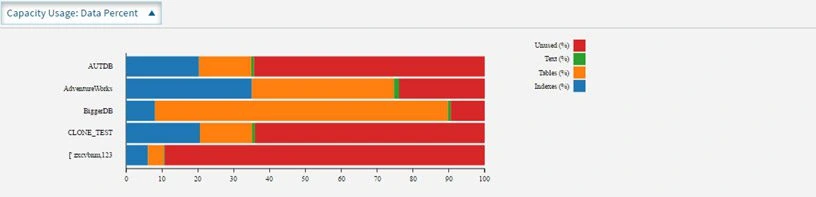
IDERA SQL Diagnostic Manager provides a Disk Space Usage Forecast report using historical growth and a collection of current storage details. It is useful when the DBA wants a repeatable estimate for monitored SQL Server disk capacity and needs to revisit the forecast as new data arrives.
It suits teams already collecting SQL Server and host metrics in the product. The forecast depends on the selected time range and whether the underlying growth rate is still representative. A report for volume space also needs to be read alongside file settings and the application’s likely next change.
Use disk-size details to confirm the reported volume and free space. Compare the figure with an independent SQL or host reading. Record which permissions and discovery options expose mount-point information on the intended SQL Server.
Capture a trend or scheduled report for one known volume. Check whether the intended metric is already collected or needs a different monitoring view. Note which reports, thresholds and alert integrations are in the selected entitlement.
- Compatibility
- SQL Diagnostic Manager with supported SQL Server instances and the required disk-monitoring permissions.
- License and trial
- Commercial IDERA licensing.
Quest Foglight for SQL Server
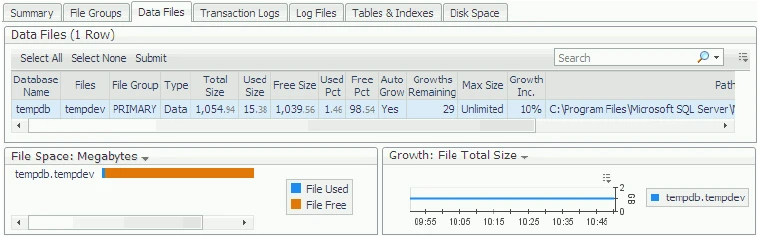
Quest Foglight for SQL Server provides historical growth views for database filegroups, data files and transaction log files. The documented views include growth increments and information about how many growths remain. That helps a DBA distinguish steady data growth from a file that has little room left under its current configuration.
It fits a team that wants to investigate the reason behind a storage constraint within a broader monitoring tool. File growth remaining depends on current settings and available space. Those charts answer a different question from application CPU headroom, which needs its own workload metrics.
Use the SQL Server cartridge and host monitoring appropriate for the selected deployment. Confirm that the volume holding a database file is represented distinctly from the database's own size. Record the data source and collection cadence.
Inspect growth before and after a test allocation. Use the same time window in each view and compare a forecast or alert with SQL Server's expected headroom. Verify the retention and plan needed for a longer baseline.
- Compatibility
- Foglight for SQL Server with file and instance collection configured.
- License and trial
- Commercial Quest licensing.
dbWatch Control Center
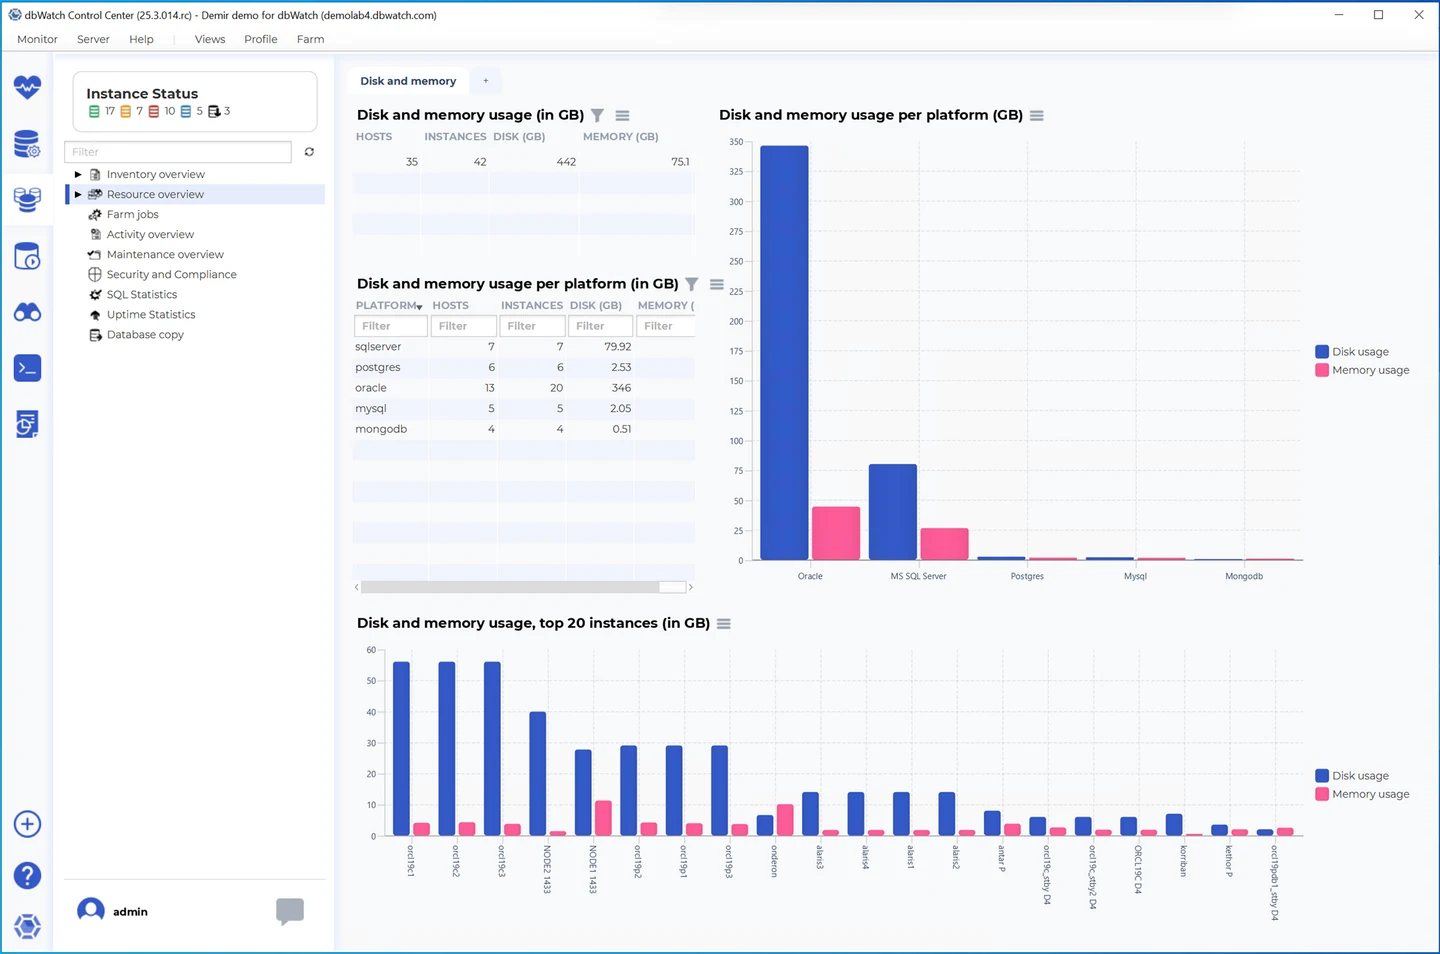
dbWatch Control Center can collect SQL Server database and log file sizes through its detailed growth job. The job can show the largest databases and their historical growth. It is useful for teams that want to see which databases are contributing to an estate-wide increase in allocated storage.
Its strengths are collection and visibility across managed instances. The selected databases and retention control how representative that view is. A capacity review can pair file-size history with usable disk headroom and the applicable service tier limit.
Run the detailed database-growth job with the intended sampling scope. Compare the run over two weeks containing both stable consumption and an allocation event. Check whether its units represent reserved storage or space actually consumed.
Export the data or report with instance and database identifiers. Pair it with host or service limits to decide when there is a real constraint. Ensure unavailable databases appear as missing evidence instead of zero growth.
- Compatibility
- dbWatch with a supported SQL Server or Azure SQL Managed Instance target and the applicable jobs enabled.
- License and trial
- Commercial dbWatch licensing.
Datadog
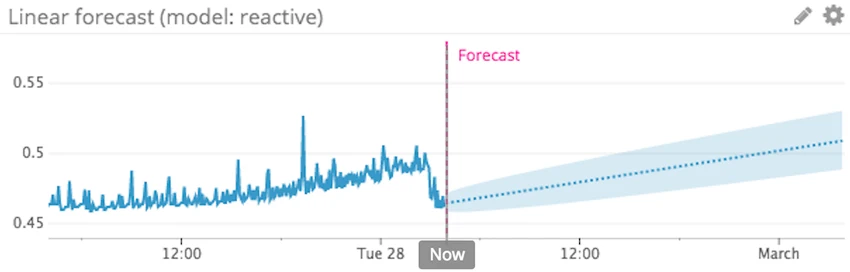
Datadog forecast monitors can project a chosen metric using linear or seasonal algorithms. With SQL Server and infrastructure integrations, a team can monitor a relevant series such as disk use or selected database metrics and alert on a projected threshold. It is useful when capacity planning already spans several infrastructure services.
The advantage is being able to choose the metric and alert window. The approach only works as well as the chosen signal. A missing tag or incorrectly grouped host can combine unrelated volumes, and an expected workload step change can make old history a poor predictor.
Choose a metric that measures the actual limiting resource and group by the correct host and volume. Check the SQL Server and host integrations separately. Keep an event annotation for planned changes such as a new database or larger log file.
Compare a static minimum-free-space rule with a forecast monitor. Confirm which data and evaluation window trigger each. Check billing and retained resolution for the metric sources needed to reproduce the result.
- Compatibility
- Datadog account and a collected, appropriately scoped metric. SQL Server and host monitoring depend on configured integrations.
- License and trial
- Commercial Datadog monitoring terms and any separately enabled products.
ManageEngine Applications Manager
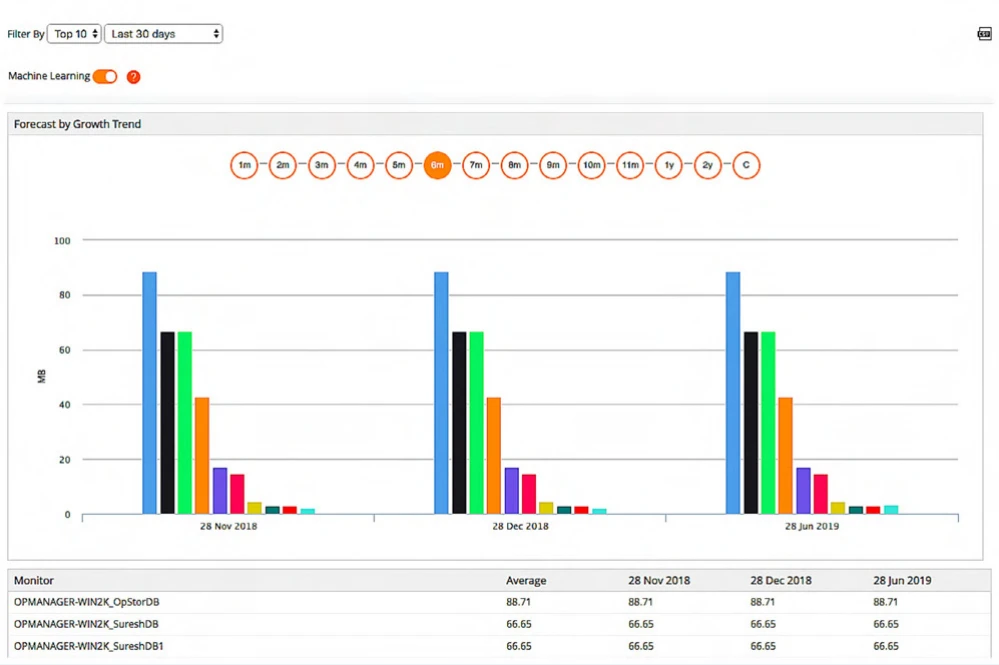
ManageEngine Applications Manager provides SQL Server monitoring and forecast reports for supported collected attributes. Its reports can project growth and utilization trends. This is useful when SQL Server runs within a wider set of applications and hosts already monitored by the same team.
It is a candidate for periodic reporting when the required attribute is collected and archived. Available reports depend on the monitor type and product version. The time range matters, especially after a database migration or a change in how the team collects storage data.
Configure the SQL Server and storage monitors needed for the same host. Select a metric with sufficient history for an appropriate forecast and compare it with the database's own allocation schedule. Record any missing intervals before using it for an estimate.
Build the applicable forecast report and then test a scheduled delivery or alert. Keep the working file size and remaining volume capacity as distinct items. Check the edition and resource scope when a report is shared across the estate.
- Compatibility
- Applications Manager with a supported SQL Server or host monitor and report history enabled.
- License and trial
- Commercial editions. Monitoring and reporting availability depend on the plan.
Azure Monitor
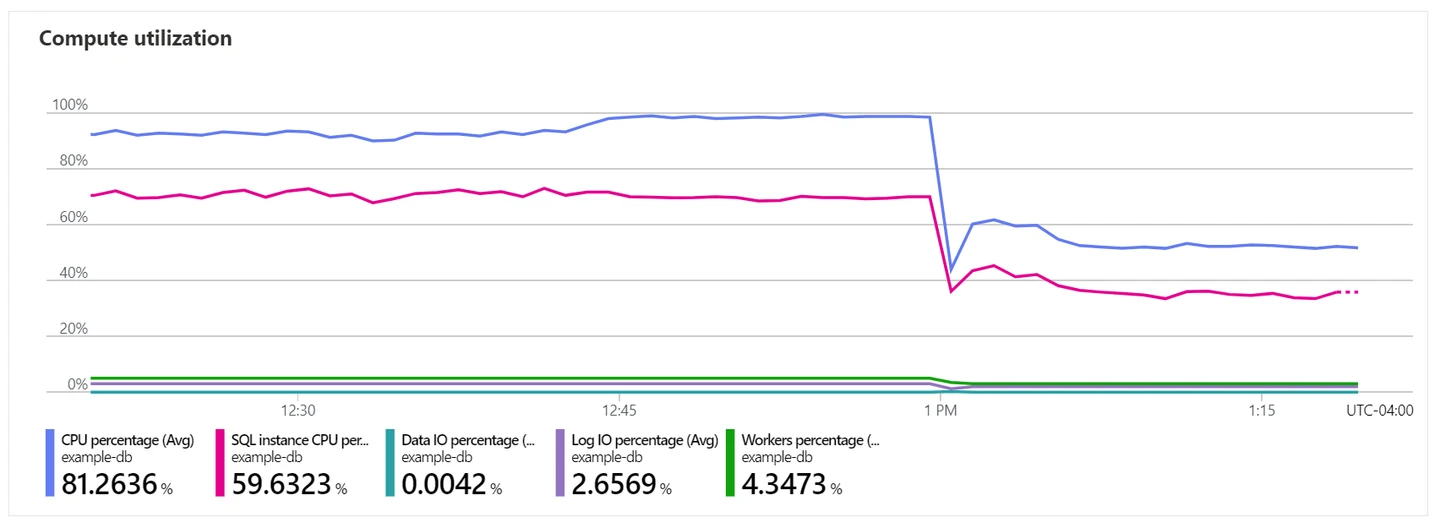
Azure Monitor collects resource metrics for Azure SQL, including service-specific storage and utilization series. Metric alerts can watch thresholds, and a team can build a forecast from available historical data where appropriate. It is useful when capacity decisions are about an Azure SQL database or managed instance and its current limits.
The strongest case is working from the platform’s own view of storage, CPU and resource usage. Available metrics differ between a database, a managed instance and SQL Server on a VM. The forecast and alert need to use the actual service limit and a metric that represents where the workload will run out of room.
Use Azure SQL Database metrics appropriate for the service tier and resource. Check whether the specific limit is storage used, allocated storage or a configured maximum. Account for the platform metric rather than substituting an operating-system disk measure.
Record the metric, aggregation and alert window. Export a history series when comparing growth over a longer period. A service limit that changes after scaling should be reflected in the planning model and the next alert threshold.
- Compatibility
- Azure SQL or other supported Azure resources with the applicable metric collection and retention.
- License and trial
- Azure monitoring, alerting, retention and resource charges depend on configuration.
Which capacity planning tool fits your SQL Server?
| What you need | Tools to shortlist | What to verify |
|---|---|---|
| Find full-disk risk across the SQL Server estate | Review the history behind each date, the drive or mount point being measured and who gets notified. | |
| Explain database and file growth before requesting more storage | Ask for an export with the database or filegroup name and verify which values measure allocated or used space. | |
| Monitor storage in an existing infrastructure platform | Match the prediction to the right resource. Use the host volume for self-managed SQL Server or the service limit for Azure SQL Database. |
Choose the capacity metric that can run out
Collect used pages and allocated file size together for data, and track transaction log and tempdb separately. Capture the correct mount or service limit and the allowed growth increment. Avoid summing free space repeatedly when several files share one volume.
The data file is filling internally
Check free pages, growth and maximum file size
Use the same file and storage volume across samples.
Other files can consume the same storage
Track the volume and an explicit reserve
Check whether the next actual growth increment fits.
The platform manages storage
Use the service metric and tier limit
Verify cloud-specific metric behavior, alerts and any quota changes.
- Redgate database growth and disk usage
- SQL Sentry forecasting reports
- IDERA disk-size details
- Quest Foglight SQL Server guide
- dbWatch detailed database growth job
- Datadog forecast monitors
- ManageEngine forecast reports
- Azure SQL Database metrics and alerts
- Microsoft sys.database_files
- Microsoft sys.dm_os_volume_stats
- Microsoft transaction log space management
Calculate how a storage allocation changes the forecast
This illustrative timeline assumes the data used grows 1 GiB per day. On day 21, a different file consumes 45 GiB on the same volume. The selected database still has 14 GiB free inside its data file, but only 15 GiB is available above a 20 GiB volume reserve. A 20 GiB growth step no longer fits the reserve policy.
Estimate runway as existing internal free space plus full growth increments that fit above the reserve, divided by the recent consumption rate. With 80 GiB volume free, three such increments fit and the estimate is 74 days. With 35 GiB volume free, the estimate is 14 days. Both estimates assume the selected file can grow and the rate stays constant.
- Day 090 GiB
- Day 790 GiB
- Day 1480 GiB
- Day 21, after separate allocation35 GiB
| Sample | File used | File allocated | Volume free | Event |
|---|---|---|---|---|
| Day 0 | 65 GiB | 90 GiB | 90 GiB | Starting point |
| Day 7 | 72 GiB | 90 GiB | 90 GiB | Usage grows inside the file |
| Day 14 | 79 GiB | 100 GiB | 80 GiB | A separate planned resize adds 10 GiB |
| Day 21 | 86 GiB | 100 GiB | 35 GiB | Another allocation consumes 45 GiB |
How to compare these tools
Check the time range and units for free space, file growth and disk forecasts. Expand a lab data file and verify the tool distinguishes allocated file size from used space and free volume capacity. Sources checked .
Test file growth and disk headroom on the same SQL Server
The following values reproduce the capacity forecast example. Substitute measured data from your lab when evaluating a monitoring tool. Keep the files, shared mount, reserve and allowed growth setting explicit.
Model SQL Server storage runway before and after a step change
T-SQL · 14 lines
- Collect file used space, allocation and volume free space on the same schedule. Record maximum file size and growth increment, and identify whether the platform exposes a disk metric or a service quota.
- Compare a steady period with a later allocation event. Calculate warning lead time for the same reserve. Keep log space and tempdb separate, and note which files share the same volume.
- Configure the product's planned alert or report and compare the result with the independent calculation. Confirm it counts full allowed growth increments and responds appropriately after a discontinuity.
Conclusion
For a Windows estate, shortlist two tools that can show forecasts for the actual volumes you need to change. If your team already tracks disk free space elsewhere, compare file and filegroup reporting before buying another host monitor. Ask each vendor to export one volume and one database history. Check the current capacity, future estimate and next growth step against the same samples.
Frequently asked questions
What should I monitor for SQL Server storage capacity?
Collect free bytes per OS volume, used and allocated data space per database file, log usage and allocated log size, and autogrowth settings and caps. For managed Azure SQL Database, track used and allocated data space and the configured database or pool limit.
How can I forecast when a SQL Server disk will fill up?
For a simple baseline, subtract your operating reserve from free space and divide by the observed rate at which free space declines. Backtest the estimate against recent history and check planned data loads, growth increments and competing workloads on that volume.
Does SQL Server log truncation free disk space?
Log truncation marks portions of the log reusable. The allocated physical log file stays the same size. Check log reuse waits, the allocated size and the volume separately when investigating pressure.
Why can a data file run out of space on a disk with free capacity?
Autogrowth might be disabled, the file or database might be at a configured limit, or there may be too little free space for the required growth increment. Check the destination volume and writeable files in the affected filegroup.
Can I use Azure Monitor to forecast Azure SQL Database storage?
Azure Monitor exposes the applicable used and allocated metrics. For a forecast, export available history to Log Analytics and model it in KQL, or calculate a trend from a metrics export. Apply the correct configured database or elastic pool limit and verify metric availability for your tier.
Why does a new database shorten the forecast for a different SQL Server database?
Files can share the same underlying volume. A new allocation reduces external capacity even if neither used nor allocated space in the original database changes. Recalculate the amount available for its next growth step.