

Grafana and Power BI can both show SQL Server data on a dashboard. Grafana is a good fit when an operator wants recent time-series data, short refresh intervals and alerts. Power BI is useful when reports need a semantic model, governed measures and drill-down across business data. Both can query SQL Server, but each puts a different amount of work on the source and the reporting layer.
An imported model or extract refreshes on a schedule and can protect SQL Server from queries generated by every dashboard interaction. A live query gives a fresher view and can increase load. The other tools here fill different needs, from lightweight self-service charts and scheduled query results to pixel-precise reports. The deciding factors are refresh expectations, database access and how the team will share the results.
Grafana vs Power BI for SQL Server at a glance
Compare the path between SQL Server and the published screen. Query execution, cache state, network access and a scheduled refresh can each affect what the viewer sees.
| Tool | Strong starting point | SQL Server access path | What to verify |
|---|---|---|---|
| Grafana | Operations dashboards and query-based alerts | SQL Server data source from the Grafana backend | Panel refresh, data source credentials, separate alert evaluation and permission scope |
| Microsoft Power BI | Governed semantic and business reporting | Import or DirectQuery with the applicable service or gateway connection | Report refresh mode, audience permissions, capacity and licensing |
| Tableau | Interactive analytics with a documented SQL Server connector | Live connection or extract workflow where supported | Published connection, authentication, extracts and viewer access |
| Metabase | Teams building SQL Server questions and dashboards | SQL Server data source configured for a server or service | Permissions, cache and schedules in the actual edition |
| Apache Superset | Self-managed analytics using a SQL Server driver | Configured SQLAlchemy driver and approved credentials | Data source access, cache, deployment and operations |
| Qlik Cloud Analytics | Governed apps with selected data access models | Documented SQL Server connector and applicable access mode | Direct Query restrictions, service/network setup and plan |
| Redash | SQL-first query dashboards and scheduled results | Configured SQL Server data source and query jobs | Actual query execution and displayed result age |
| SQL Server Reporting Services | Paginated reports and native-mode subscriptions | Configured SQL Server report data source and scheduled delivery | Stored credentials, parameter set, schedule and delivery format |
Grafana
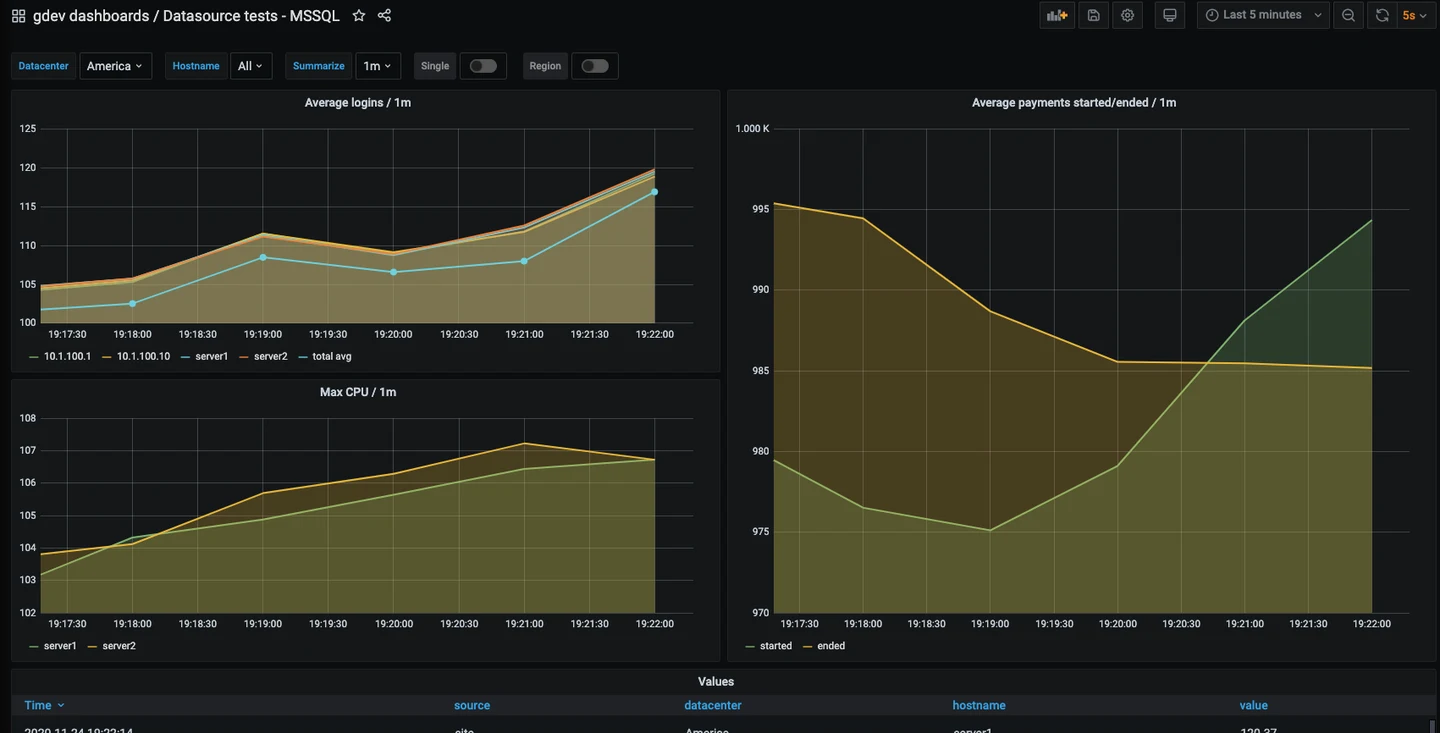
Grafana’s Microsoft SQL Server data source can run T-SQL for dashboards and supported alert queries. It supports time-series query formats and macros that expand a dashboard time range into SQL. That makes it useful for operational charts such as recent job durations or database metrics.
Its strength is flexible SQL and a monitoring-oriented display. A fast refresh can run several queries for each open dashboard, so source volume and query cost matter. The SQL account should provide only the access needed, since dashboard authors can submit queries against that connection.
Configure the Microsoft SQL Server data source with a dedicated reader on the required views or tables. The Grafana server or hosted connection reaches SQL Server. Test this path separately from whether a viewer can open the web dashboard.
Set a deliberate refresh interval and test one panel with the same SQL and time filter. Check data source permissions and any enabled cache. Configure the alert query separately and compare its evaluation and notification times to the panel.
- Compatibility
- Grafana with an accessible Microsoft SQL Server data source and supported authentication.
- License and trial
- Open-source self-managed Grafana and commercial cloud or enterprise plans.
Microsoft Power BI
Microsoft Power BI can import SQL Server data into a semantic model or send queries through DirectQuery. It is useful when users need common measures, scheduled refresh or interactive business reporting across several subjects. The choice of storage mode changes how current data is and where queries run.
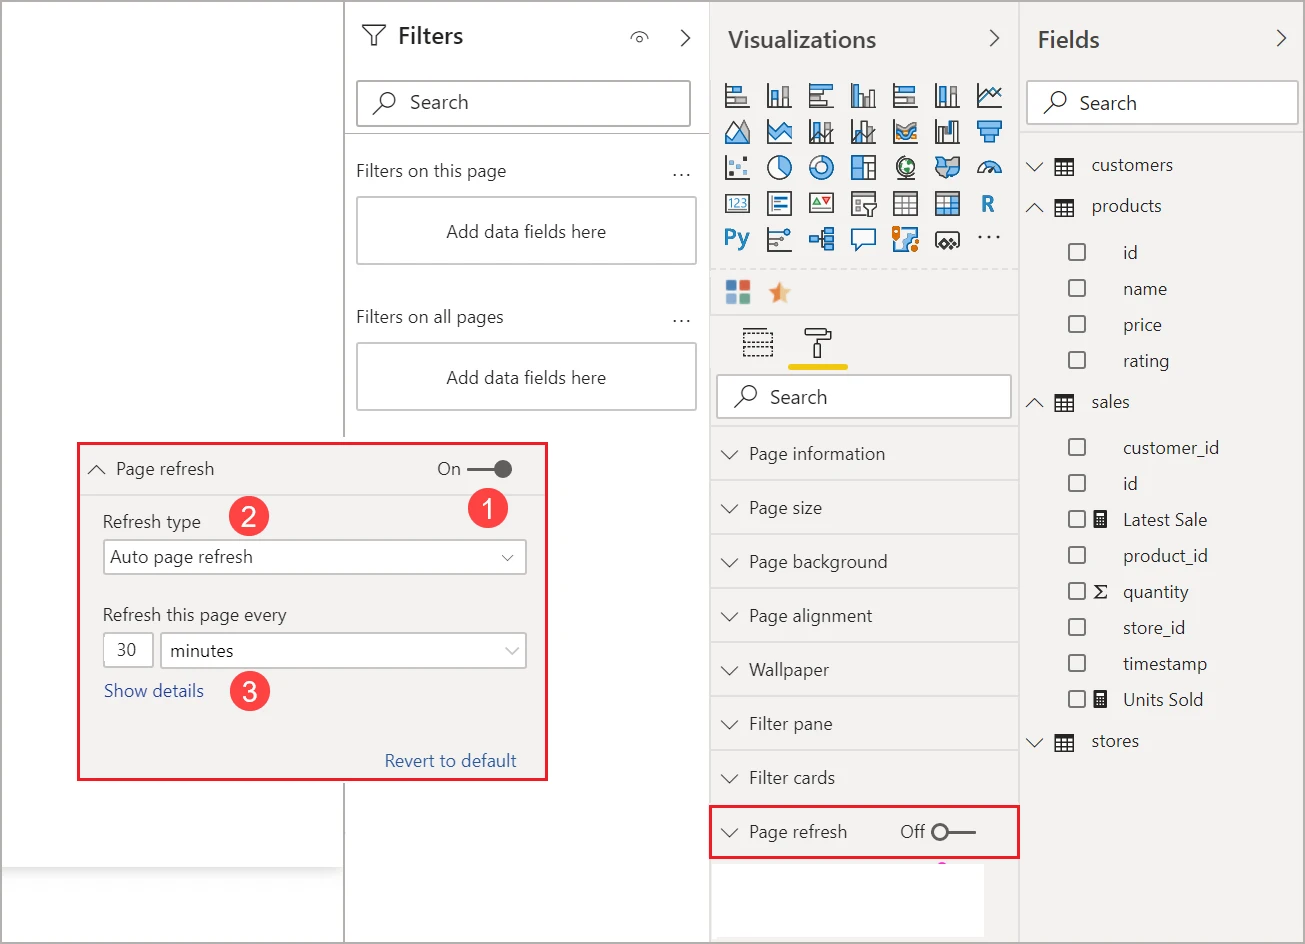
Power BI is strongest when someone owns the model and publishing pipeline. Automatic page refresh and scheduled dataset refresh have different requirements. On-premises connectivity commonly involves a gateway after publication, and DirectQuery performance depends on the model and SQL Server.
Build Import and DirectQuery versions using the same SQL Server fields. If publishing to a service that requires the gateway for this source, verify mapped server and database names and the credentials used. Test the published report with the intended viewer account.
Import shows the refreshed model, while DirectQuery loads or refreshes visuals through source queries subject to service, caching and query behavior. Configure automatic page refresh where supported. Record capacity limits, audience roles and the actual data seen after one known update.
- Compatibility
- Supported Power BI Desktop or service workflow. On-premises refresh or live access may require a gateway.
- License and trial
- Desktop authoring is available free. Sharing and capacity depend on the license and deployment.
Tableau
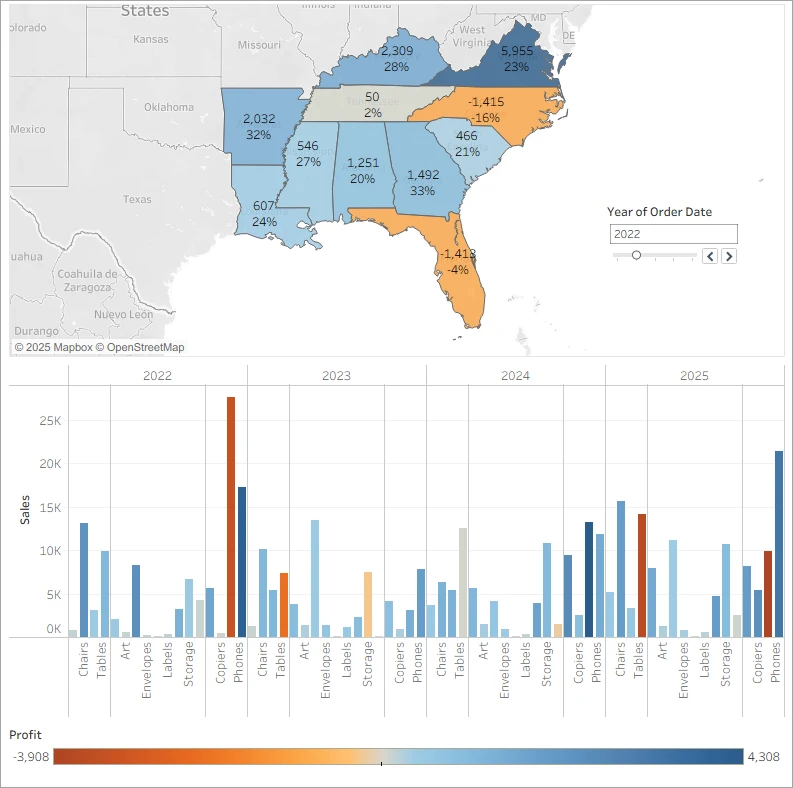
Tableau connects to SQL Server and can use a live connection or an extract, depending on the workflow. This gives analysts a choice between querying the source and working with a refreshed extract. It is useful for teams that want interactive exploration and already distribute dashboards through Tableau.
The connection mode determines freshness and database load. Tableau Cloud may use Bridge to reach network-restricted data. The workbook, extract schedule and permissions all influence what viewers see, especially when the report moves from a developer workstation to a shared service.
Compare a live SQL Server connection and the extract workflow when the workbook supports both. Publish with the intended authentication settings and use a viewer with realistic permissions. Check whether the published connection uses the expected identity.
Change the lab row and record when it appears in the browser. Test an intentional delay in the extract schedule separately. Save query timings and source load or connector logs before choosing a mode.
- Compatibility
- Tableau with the supported SQL Server connector and applicable Desktop, Server or Cloud connectivity.
- License and trial
- Commercial Tableau licensing. Bridge and deployment needs depend on the setup.
Metabase
Metabase connects to Microsoft SQL Server and lets users build questions, write SQL and arrange the results in dashboards. It is useful when a small team wants direct access to selected database data without building a larger semantic model or an application for each report.
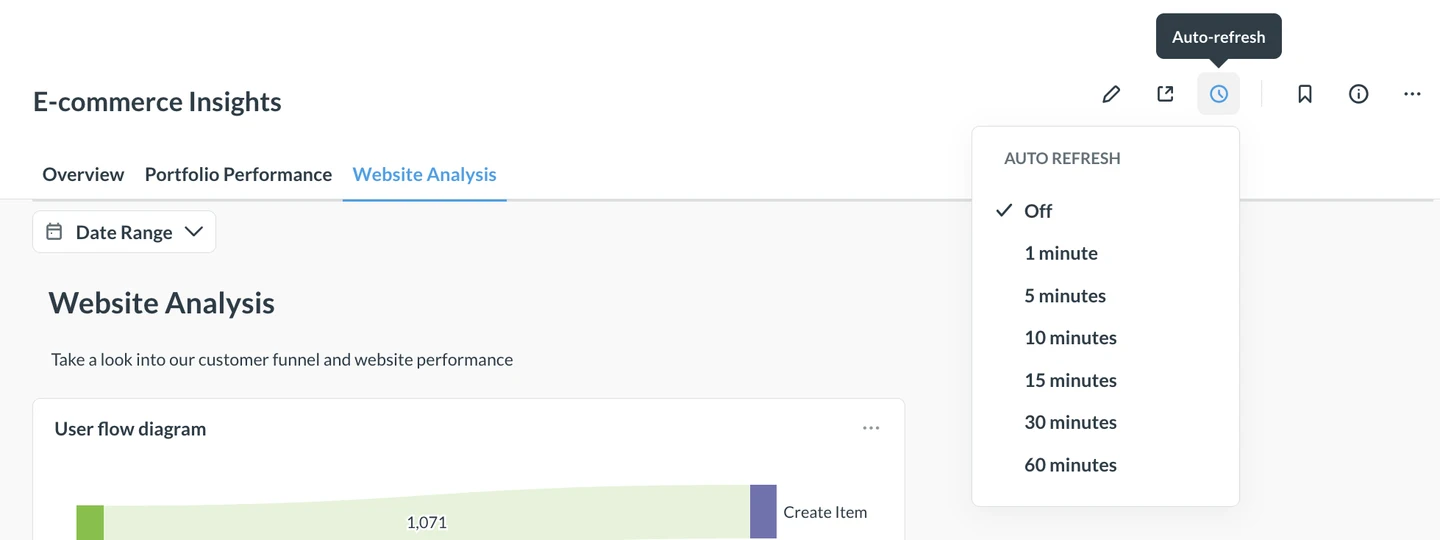
It fits fairly straightforward internal reporting with controlled database access. Automatic refresh can rerun the underlying questions, and public or embedded sharing changes the access design. The team can use separate database permissions and application permissions to limit what people can see.
Connect the documented SQL Server data source using a scoped user. Build a saved question against the fixture and check any query result caching before measuring update visibility. Review the permissions that the intended viewer receives.
Test the published dashboard and any scheduled delivery feature under the chosen plan. Compare a manual refresh and a normal viewing cycle. Confirm whether the database was queried and whether the row matched the approved snapshot.
- Compatibility
- Self-hosted or managed Metabase with a supported SQL Server connection.
- License and trial
- Open-source and commercial editions. Sharing and embedding features vary by plan.
Apache Superset
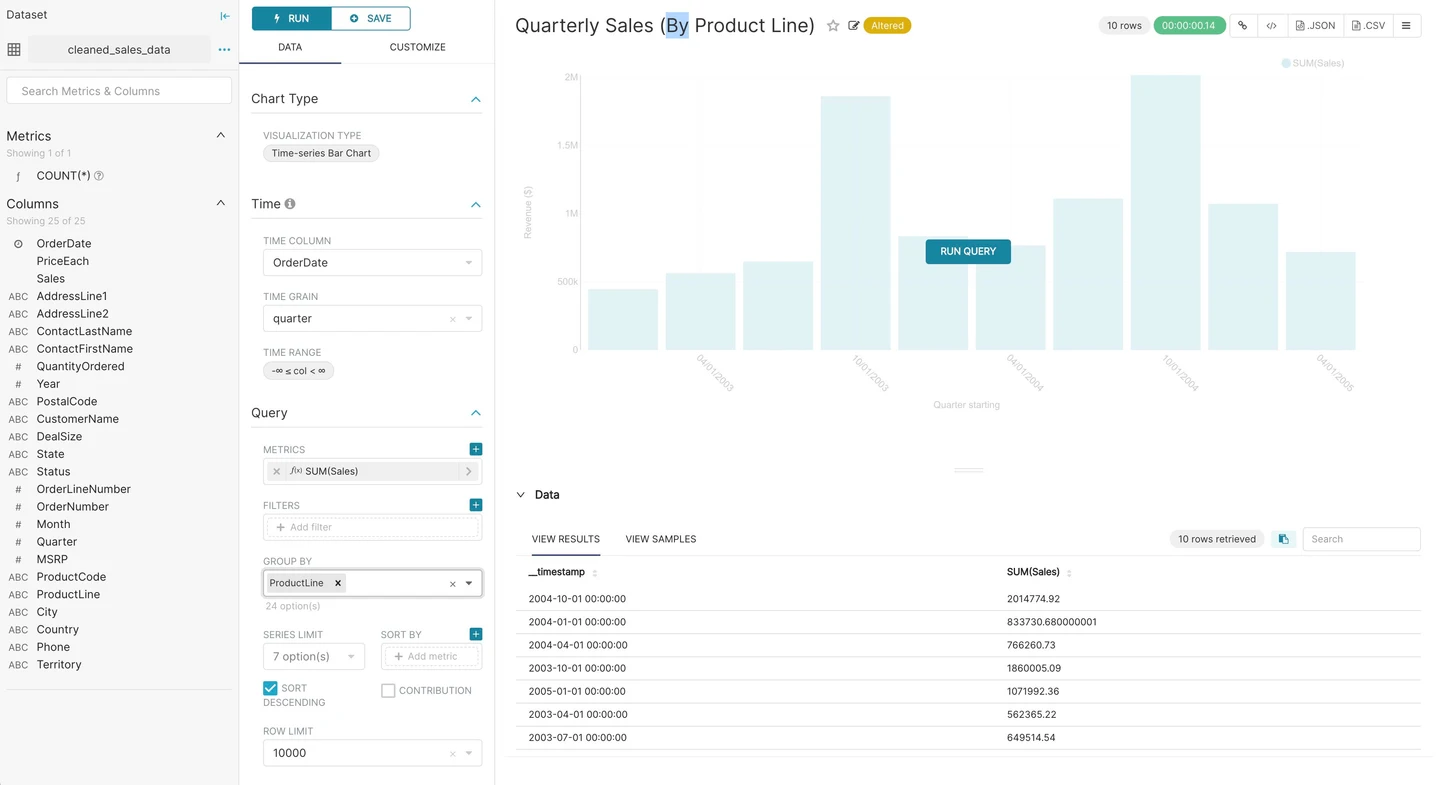
Apache Superset can connect to SQL Server through a supported SQLAlchemy driver and make dataset-based charts available in dashboards. It is useful when a team wants a self-managed browser BI tool, can operate the dependencies and needs to query several database engines.
The strength is control over how the reporting service is deployed. Driver installation, SQL Server connectivity, query caching and user roles are part of making it reliable. The design has to account for expensive source queries and which queries the service actually reruns.
Use a documented SQL Server driver in the actual Superset runtime. Verify credentials and TLS at the application host. Configure a chart over the small SQL Server query and check the role used for the displayed data.
Inspect both the chart cache and any asynchronous query settings. Change the lab value and record when the new result reaches the viewer. Track the infrastructure and maintenance needed for shared reporting.
- Compatibility
- Superset deployment with a supported SQLAlchemy dialect and SQL Server driver.
- License and trial
- Free, open-source project. Hosting and operational work remain with the team.
Qlik Cloud Analytics
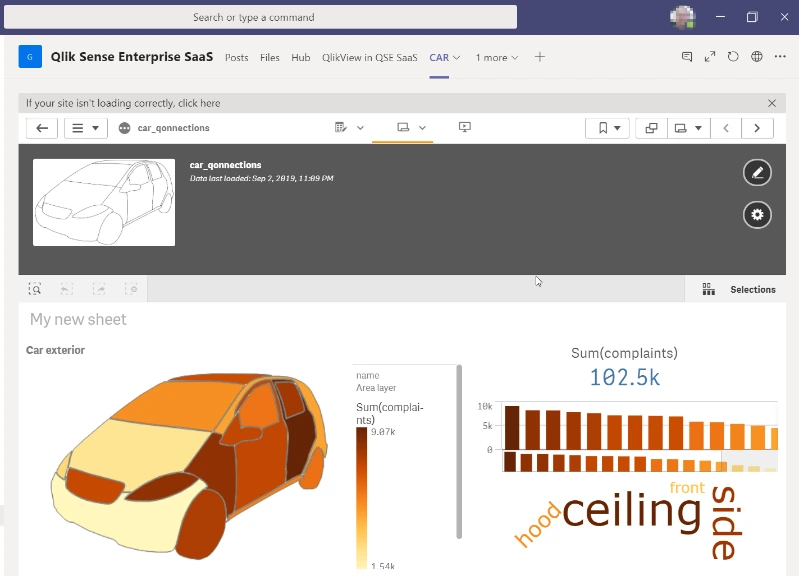
Qlik Cloud Analytics connects to Microsoft SQL Server through a supported connector and can load the result into its analytics workflow. It is useful when reporting involves selecting and exploring related business data across several sources in the same Qlik application.
Its strengths are guided data exploration and a shared reporting application. Reload schedules and network access determine how fresh SQL Server data is. The model and access rules need particular attention when several data sources contribute to the same view.
Choose the documented Qlik Cloud access mode and compatible SQL Server connection. If Direct Query is required, verify supported data-source paths, available functions and network access. Use the same small object to compare with a loaded app.
Measure manual and configured refresh paths in the published workspace. Test whether a viewer's access changes the returned rows. Compare observed freshness and the service configuration that was needed to get it.
- Compatibility
- Qlik Cloud Analytics and a supported SQL Server connector or gateway configuration.
- License and trial
- Commercial Qlik subscription. Capacity and connectivity terms vary.
Redash
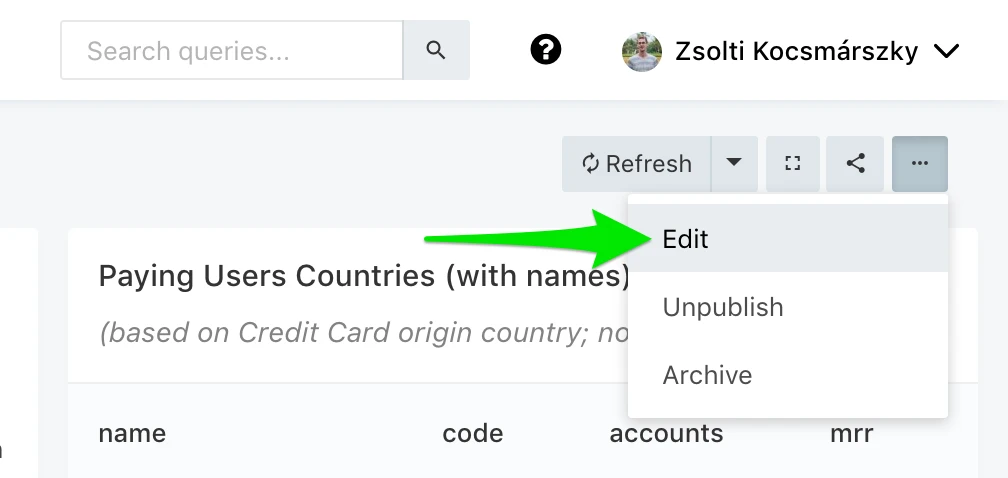
Redash lets an operator create saved SQL queries and display visualizations based on their results in a dashboard. With a supported SQL Server data source, it is useful for lightweight internal reporting where the team is comfortable defining the required data in T-SQL.
Its appeal is the direct path from a saved query to a dashboard or scheduled result. The freshness readers see depends on caching and query schedules. Access to the data source and the saved result still needs deliberate configuration, particularly when dashboards are shared.
Schedule the saved query using the documented scheduling workflow. Check when the dashboard last received a successful result and whether manually rerunning the query updates the current view. Verify target credentials independently.
Use the marker value and timestamp to distinguish an old saved result from a query waiting for execution. Keep the query-job activity and any SQL Server query evidence so you can identify which part contributed to the delay.
- Compatibility
- Self-managed Redash deployment with its supported SQL Server query runner and connection.
- License and trial
- Open-source tool. Hosting, maintenance and access management remain with the team.
SQL Server Reporting Services
SQL Server Reporting Services delivers server-hosted paginated reports using data sources such as SQL Server. It fits reports with fixed sections, precise formatting, subscriptions or exports. A DBA can use it when a standard printed or emailed report is the main artifact people need.
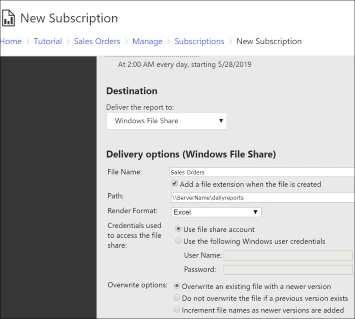
The strength is controlling report layout and delivery. Dashboard interaction and alerting follow different workflows. Report credentials and schedules determine when SQL Server is queried, and the report server version determines which deployment and subscription capabilities are available.
Create a small report with a documented native-mode data source and subscription where supported. Match the identity, parameter set and output format to the planned delivery. The test can verify the output without relying on a large report.
Compare the data in a rendered report and a scheduled result after the marker changes. Record snapshot or execution timing and whether a stored credential or SQL Server permission affected the outcome.
- Compatibility
- Supported SSRS deployment with SQL Server data-source connectivity.
- License and trial
- SQL Server and report-server licensing depend on the deployment.
Grafana and Power BI features for SQL Server
| Feature | Grafana | Microsoft Power BI |
|---|---|---|
| Where it fits | An incident screen with SQL Server metrics next to service and infrastructure data. | A published report with shared business measures and per-viewer access. |
| SQL Server query mode | The Microsoft SQL Server data source executes queries when a panel refreshes or an alert rule evaluates. | Import copies data into the semantic model. DirectQuery can run SQL Server queries for visuals and supports Automatic Page Refresh in eligible reports. |
| Freshness in the published view | Dashboard refresh and alert evaluation have separate intervals. The configured minimum refresh, network latency and query cost matter. | Regular shared workspaces have a 30-minute minimum for Automatic Page Refresh. Dedicated capacity settings can differ. Measure from the published report. |
| Access to a private instance | Grafana needs a route to SQL Server. Use a scoped read-only login or one of the supported authentication methods. | For on-premises SQL Server with Power BI Service, configure the gateway and data-source mapping. Check the credentials and delegation model. |
| Alerts with the dashboard closed | Configure a Grafana-managed rule with a suitable SQL Server time-series query and contact point. | Automatic Page Refresh refreshes the report page. Configure and test the applicable alerting feature separately. |
| Viewer data access | Control the database account's access to views or tables. Check the data source permissions available in your edition. | Define row-level security on the semantic model where needed. Verify using a real Viewer account in the published workspace. |
Which dashboard tool fits the work?
| What you need | Tools to shortlist | What to verify |
|---|---|---|
| Show current SQL Server status and alert during incidents | Watch the time from a SQL write to a panel update. Test an alert after closing the dashboard. | |
| Share reports with business measures and filtering | Publish first. Test the refresh interval and row access as a viewer using the production connection type. | |
| Give analysts query-based dashboards from SQL Server | Inspect the query count, SQL execution time and cache behavior after a known data change. | |
| Schedule paginated reports for an existing on-premises estate | Compare the report's source timestamp with its run or subscription time. Check the installed version. |
Choose the path from SQL Server to the viewer
Start with how people use the dashboard. Operational alerting, interactive models and scheduled paginated reports place different requirements on refresh and delivery.
An operations screen polls SQL Server and needs alerts
Use Grafana panels and alert evaluation
The Grafana data source queries SQL Server. Panel refresh and rule evaluation have separate schedules.
Business analytics should query a refreshed model
Use Power BI Import
Refresh takes data from SQL Server into the semantic model. Viewers query that imported state.
Power BI visuals should query the source
Use DirectQuery and verify published refresh behavior
Check gateway, query load and automatic page refresh rules for the service and capacity.
- Grafana SQL Server data source
- Grafana SQL Server alerting
- Power BI DirectQuery
- Power BI automatic page refresh
- Power BI SQL Server gateway
- Power Query SQL Server connector
- Tableau SQL Server connector
- Metabase SQL Server data source
- Superset SQL Server driver
- Qlik Direct Query
- Redash query schedule
- Microsoft SSRS subscriptions
Measure when a known SQL Server update reaches each dashboard
Display the value and its stored UTC update time in the visual. Update the row once in SQL Server and compare manual refresh, normal schedules and observed query volume. Test configured cache or permissions separately from the update.
Access decisions belong to the data and report layers. Check the effective SQL Server identity behind Grafana or the Power BI connection, then verify the viewer's authorized data scope. A filter selected on a visual is a display setting.
| Mode | After SQL value changes | Evidence to record |
|---|---|---|
| Grafana panel | Check a manual panel refresh and configured interval | First updated value, source query count, and cache setting |
| Grafana alert | Wait for the configured separate evaluation | Evaluation time, alert result and notification time |
| Power BI Import | Refresh the model and then inspect the published visual | Refresh history, completion time and first visible marker |
| Power BI DirectQuery | Interact with the report or test supported page refresh | Visual and gateway behavior, source queries and delay |
| Permission or cache test | Change one controlled condition | Confirm expected filtering or changed latency without different SQL input |
How to compare these tools
Use the same status query and reporting dataset. Check data age, refresh following a change, who can see the underlying data, and whether an alert reaches the right person. Sources checked .
- Grafana SQL Server data source and query documentation
- Grafana alerting from SQL Server time-series queries
- Microsoft SQL Server connector and DirectQuery
- Microsoft Power BI automatic page refresh and service limits
- Microsoft Power BI semantic model refresh and gateway requirements
- Microsoft Power BI row-level security
Measure how long a SQL Server change takes to appear
Use a disposable database named DashboardFreshnessTrial. The setup creates one stable data marker. Publish the dashboard from the initial value and then change it once with the same batch.
Seed and change a reproducible SQL Server dashboard marker
T-SQL · 22 lines
- Run the batch with @ApplyUpdate = 0 and connect each product to the table or an approved read-only view. Show MetricValue and UpdatedAtUtc and record the initial value of 10.
- Set @ApplyUpdate = 1 and run once to store 11 and its SQL Server UTC timestamp. Measure manually triggered visibility and normal schedule separately. Record SQL query counts or applicable gateway evidence.
- Recheck after changing a cache or viewer policy in the lab. Verify which query and identity were involved. Use independent refresh and alert measurements when comparing operational behavior.
Conclusion
Use Grafana for incident panels that need a short refresh cycle and independent SQL-based alerts. Use Power BI for a published report that needs governed measures and report access. Measure the refresh time and query load in the environment where people will use it. Put the latest SQL sample time where an operator can see it without opening another panel.
Frequently asked questions
Is Grafana or Power BI better for a live SQL Server dashboard?
Grafana usually fits an incident view with short dashboard refresh intervals and SQL-based alert rules. Power BI fits reports with a semantic model, shared measures and access roles. Its published refresh behaviour depends on the connection mode and workspace capacity.
Does Power BI DirectQuery make the screen update automatically?
DirectQuery lets report visuals query the SQL Server source. Automatic Page Refresh is a separate report setting for eligible pages and data sources. Shared Power BI workspaces have a documented 30-minute minimum for this feature.
Can Grafana alert directly on SQL Server query results?
Yes. Grafana documents managed alert rules using SQL Server time-series queries. Return the expected time and numeric values, then test evaluation and notification independently from the dashboard refresh.
How can I tell whether a SQL Server dashboard is stale?
Display the latest collected SQL timestamp and its age in minutes. Compare that value with the expected sampling interval. The browser refresh time can be recent while the latest data remains old.
Which tools can send scheduled reports from SQL Server?
Existing SSRS deployments can use report subscriptions. BI products offer scheduled delivery depending on the deployment and license. Test the source data timestamp inside the scheduled output and verify who receives it.
How do I compare Power BI Import and DirectQuery freshness?
Change one source row with a stored UTC timestamp and record when each published visual shows it. In Import, include model refresh. In DirectQuery, check page refresh and actual source queries under the configured service and gateway.