

Self-hosted SQL Server dashboards can query the database live, load an extract or use an application-managed model. Live queries can show current operations while placing load on the source. Extracts and models can support more predictable viewing and shared calculations, with refresh and storage to manage. Which route fits depends on how often the data changes and what the dashboard is used for.
Self-hosting also makes the reporting team responsible for the connection pool, identities and deployment. A viewer’s access may be enforced in the dashboard platform, in SQL Server or in both. Compare the tools using a real dashboard, the intended refresh schedule and a user who should only see a limited set of rows.
Self-hosted SQL Server BI dashboard tools at a glance
Select a deployment model first. Check which application database, configuration, keys and assets carry the dashboard and its permissions.
| Tool | SQL data path | Host responsibility | Recovery evidence |
|---|---|---|---|
| Metabase | Documented SQL Server connection and queries | Run application and its metadata database | Restored dashboard, credentials and role scope |
| Apache Superset | Supported SQL Server SQLAlchemy driver | Web server, metadata and configured workers | Restored charts and controlled database access |
| Grafana | Built-in Microsoft SQL Server data source | Server, dashboards and provisioning state | Restored datasource and panel query |
| Power BI Report Server | Supported report types and SQL Server data sources | Report server and required catalogs | Recovered report and expected dataset |
| Tableau Server | SQL Server live connection or supported extract | Server deployment, repository and refresh jobs | Working workbook, data source and authorized access |
| Qlik Sense Enterprise on Windows | SQL connections and configured apps | Windows cluster, content and reload controls | Recovered app and tested scheduled reload |
| Sisense | Documented SQL Server connection | Self-hosted platform and model lifecycle | Restored dashboard and actual SQL query data |
| IBM Cognos Analytics | SQL Server connection and supported models | Content store, dispatch and security configuration | Recovered report and permitted output |
| Redash | Microsoft SQL Server query data source | Web, workers and stored dashboard state | Restored dashboard and query access |
Metabase
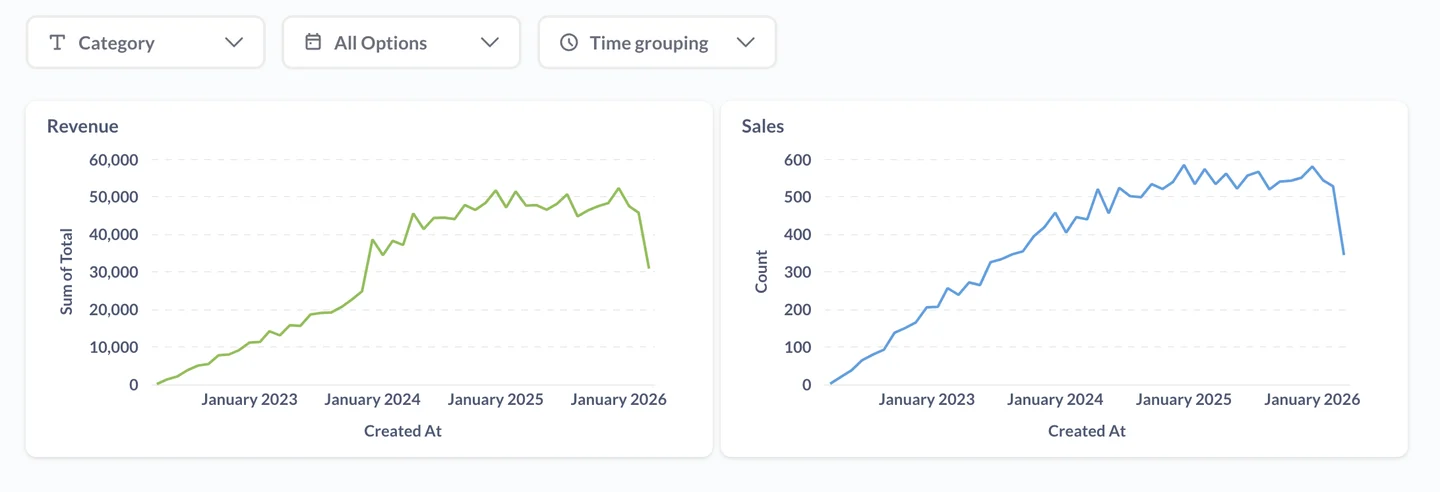
Metabase connects to SQL Server for visual questions, SQL queries and dashboards from a self-hosted application. It is useful when a team needs internal self-service reporting and already knows which database objects users should be able to query.
Its strength is making questions and dashboards available with relatively little report-development setup. Native SQL, visual access and protected collections have different permission paths. The team needs an application database, drivers and an operating plan for refresh and query load.
Document the application database separately from the SQL Server reporting source. Back up the metadata using the documented Metabase approach and verify required encryption settings for stored connection details.
Restore the dashboard and its connection on an approved alternate host. Use the intended viewer role and confirm the SQL fixture's labels and total before counting recovery as successful.
- Compatibility
- Self-hosted Metabase with supported SQL Server connectivity.
- License and trial
- Open-source and commercial Metabase editions.
Apache Superset
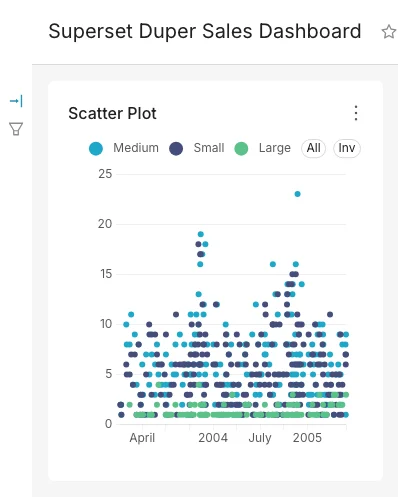
Apache Superset can connect to SQL Server through an eligible SQLAlchemy driver and publish datasets, visualizations and dashboards. It is useful for teams that want a flexible open-source platform and can manage its web application, metadata database and query workers.
The benefit is separating the reporting application from the data engines it serves. Drivers, asynchronous query configuration, caching and application roles affect the deployed system. The team still owns security setup and the work required to make dashboards reliable under load.
Use the documented SQL Server driver and schema or query scope. Record which configuration, secret keys, metadata database and worker services the deployed Superset environment needs.
Recover the saved dashboard and charts to a lab host. Verify connection and permissions, then run the known SQL view under the intended role rather than only opening the application shell.
- Compatibility
- Superset with a supported SQL Server driver and deployment architecture.
- License and trial
- Free, open-source software. Infrastructure costs remain with the team.
Grafana
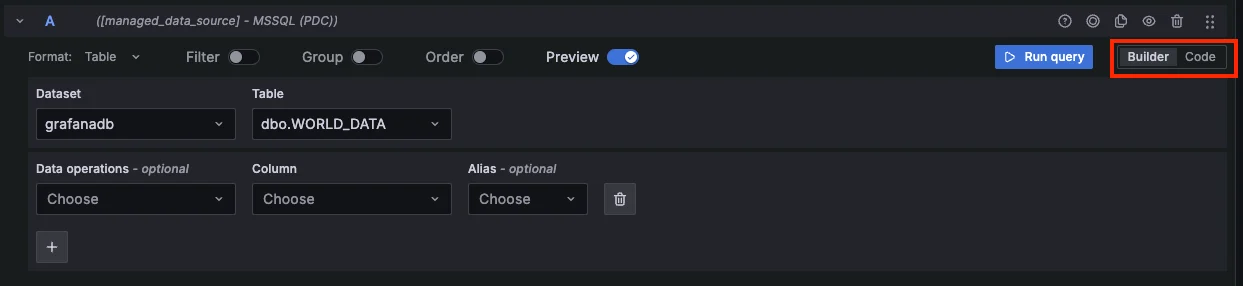
Grafana has a Microsoft SQL Server data source with time-series query support and macros for time filters. It is useful for operational dashboards where users need current state, recent trends or alert queries alongside measurements from other systems.
Its strength is operational visualization and alerting. Fast-refresh dashboards can submit many live SQL Server queries, so a suitable query account and source design matter. Complex business reporting or an externally managed semantic model follows a different workflow.
Use the built-in SQL Server data source and determine whether dashboards and data connections are provisioned or stored in the Grafana database. Back up the relevant state according to Grafana's documented process.
Restore the panel and connection to an alternate Grafana lab. Review the SQL refresh and data results and confirm which roles can edit the data source or query new scopes.
- Compatibility
- Self-hosted Grafana with valid Microsoft SQL Server connectivity and access.
- License and trial
- Open-source Grafana and eligible commercial features.
Power BI Report Server
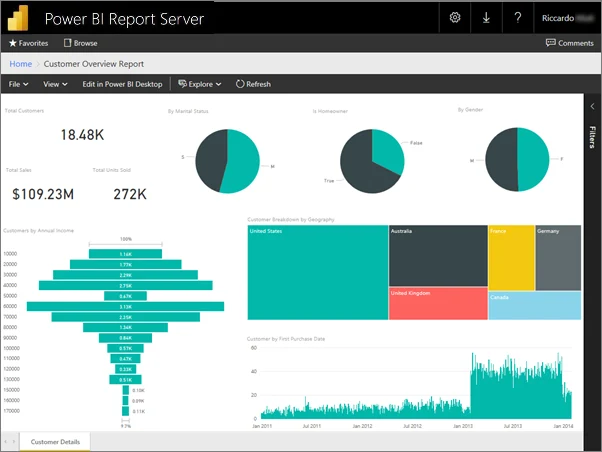
Power BI Report Server can serve supported Power BI and paginated reports with SQL Server data sources. It is useful when an organization wants self-hosted Microsoft reporting and already maintains its models or report definitions with the Report Server-compatible authoring tools.
The platform’s report type and version determine which data source mode and refresh options are available. Stored credentials, gateway or network requirements and SQL load come from the deployed configuration. Paginated subscriptions and Power BI reports also have different delivery behavior.
Match the selected report type to Power BI Report Server's data source support. Record what a replacement requires from the report catalog, server configuration and data connection security.
Recover the report and use the effective test account to access it. Compare the original and restored data bindings and check known SQL fixture values after recovery.
- Compatibility
- Eligible Power BI Report Server and compatible authoring and SQL Server software.
- License and trial
- Applicable Microsoft Report Server licensing.
Tableau Server
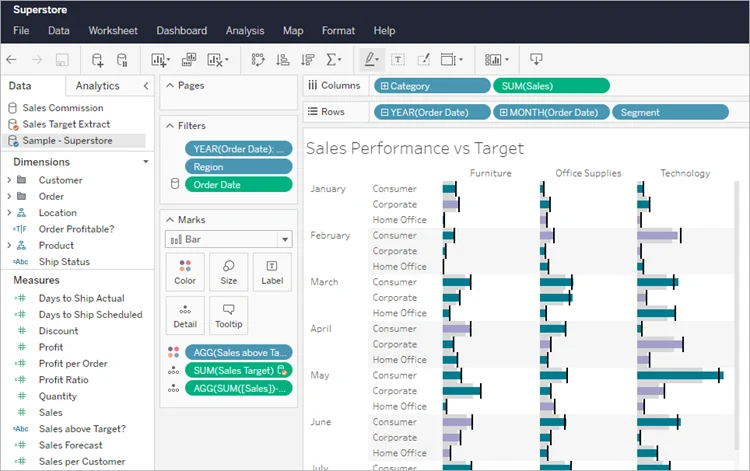
Tableau Server distributes dashboards and published data sources that can use supported SQL Server connections and extracts. It is useful when an organization wants centrally governed workbooks and already uses Tableau for exploration and business reporting.
Live and extract modes behave differently under user load and serve different freshness requirements. Server authentication, drivers and data-source permissions determine how users can query SQL Server. Extract refresh and workbook publication have their own operations workload.
Choose live or extract in the documented SQL Server workflow and record the restore requirements for published content and any extracts. Use the same site role for testing before and after recovery.
Verify the published workbook, data source and refresh result. Check if the restored workbook's current query actually reflects the SQL fixture rather than an earlier extract.
- Compatibility
- Supported Tableau Server host and SQL Server connection and drivers.
- License and trial
- Commercial Tableau licensing.
Qlik Sense Enterprise on Windows
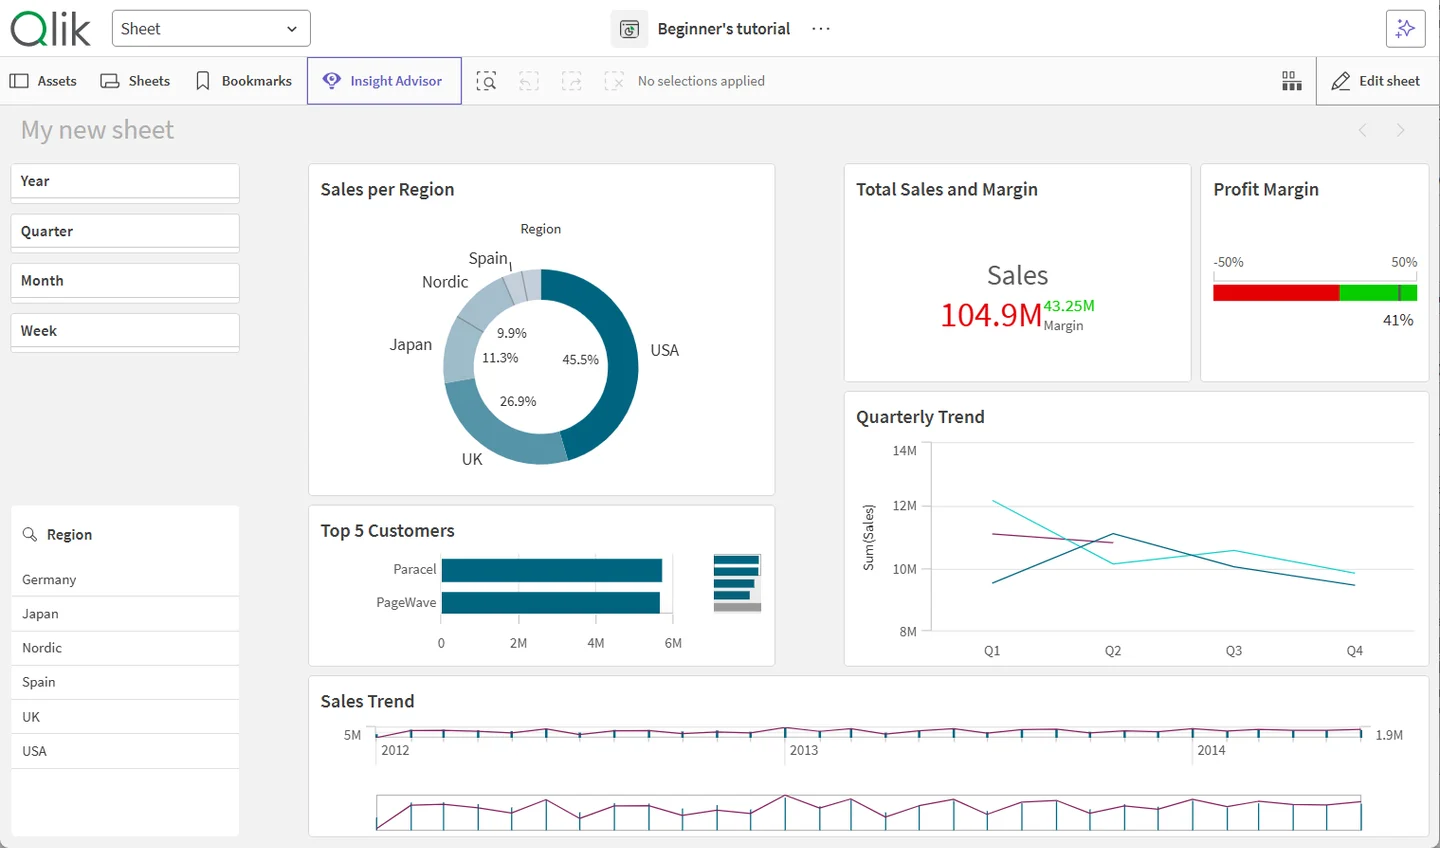
Qlik Sense Enterprise on Windows can load SQL Server data through a configured connection and publish applications to a managed Qlik deployment. It is useful when analysts want the associative exploration and app distribution workflow while the organization manages hosting itself.
The model and reload process determine freshness and source load. Application permissions and any reduction of data by user need to be configured for the published app. A pilot should exercise a regular reload and show what a restricted viewer can actually explore.
Use the supported database connection in the chosen Qlik Sense on Windows environment. Record owned apps, reload tasks, credentials and relevant site configuration.
Recover a test app or platform workflow and verify its visibility, data reload and rows under an intended viewer. Keep configuration and data backup evidence separate.
- Compatibility
- Qlik Sense Enterprise on Windows with a supported SQL Server connection.
- License and trial
- Commercial Qlik licensing.
Sisense
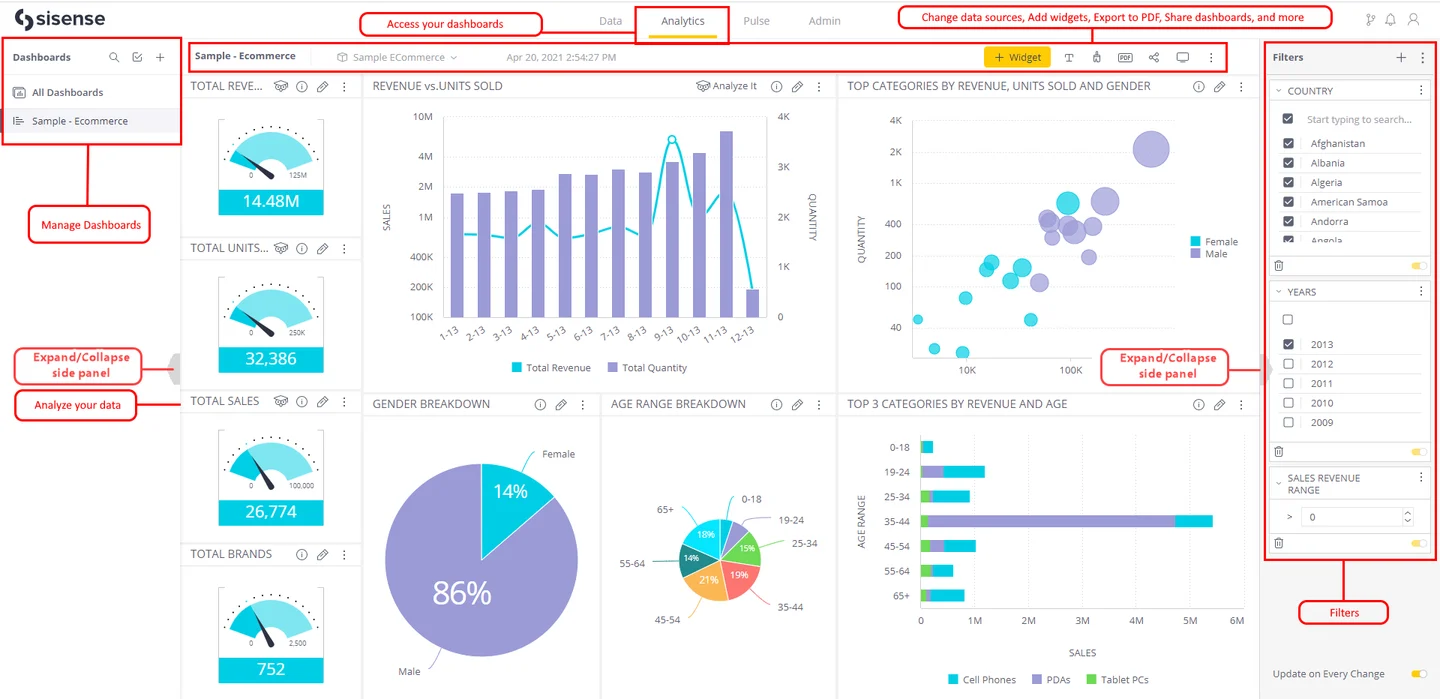
Sisense supports connections to SQL Server for its documented data models and can provide dashboards from a self-managed deployment. It is useful when the team wants a managed analytical layer around SQL Server and needs to serve or embed dashboards in its own environment.
Live and imported data paths differ in refresh, compute and security. Model settings and account permissions determine what the dashboard exposes. Host requirements and the platform’s operational footprint matter alongside the cost of SQL Server queries.
Check the documented SQL Server connections and destination modeling path for the deployed Sisense edition. Record how dashboards, data models and account configuration are recovered.
Restore the trial dashboard and verify model rebuild or refresh on the replacement target. Compare live query values and intended role visibility with the source SQL.
- Compatibility
- Supported Sisense deployment and SQL Server connection or model configuration.
- License and trial
- Commercial Sisense licensing.
IBM Cognos Analytics
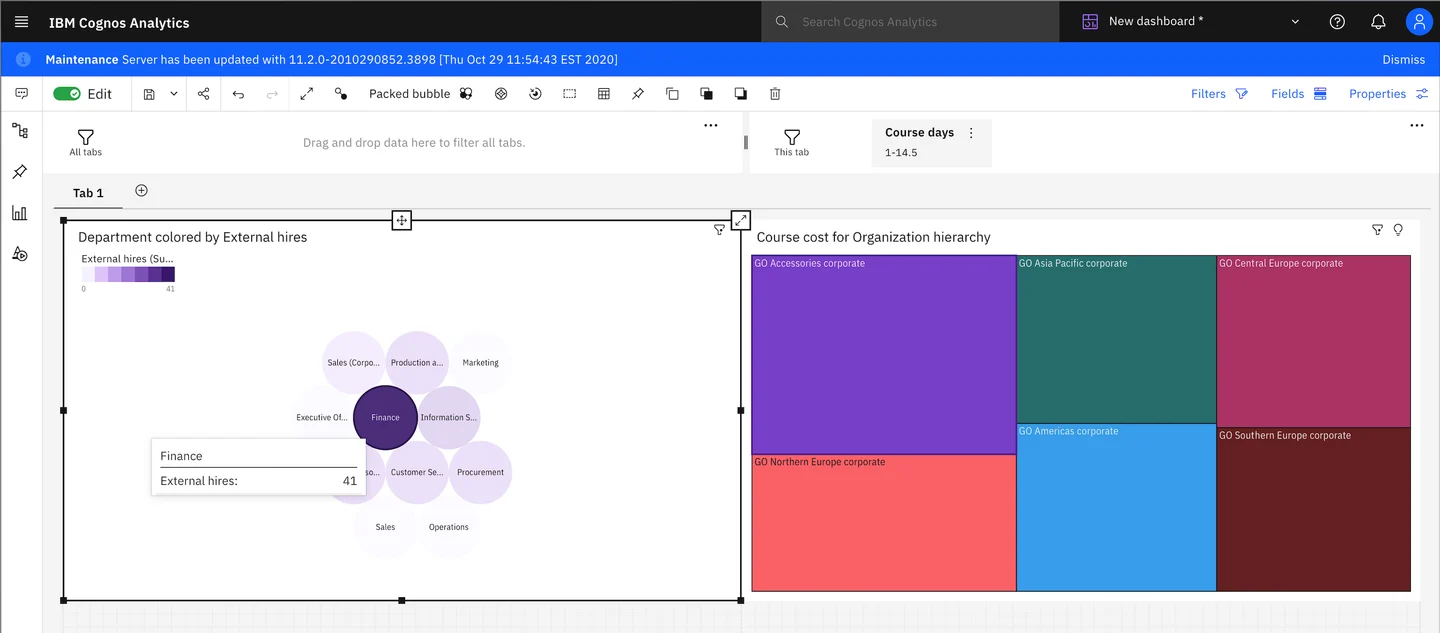
IBM Cognos Analytics can use SQL Server as a documented data source and provide enterprise reporting and dashboards through its supported deployment. It is useful when an organization already uses Cognos packages, data modules or administrative workflows for governed reports.
Its strength is operating reports inside a broader modeling and permissions environment. JDBC drivers, authentication and the package or model shape the query path. Reporting schedules and the complexity of provisioning access need to match team capacity.
Confirm IBM Cognos SQL Server connectivity and the intended data model. Inventory content, security configuration and SQL access through the deployed dispatcher workflow.
Reopen the recovered report as the lab viewer and validate known values. Check that saved database connections only work under the intended permissions and that refresh behavior is reproducible.
- Compatibility
- Supported Cognos Analytics deployment with appropriate SQL Server drivers and access.
- License and trial
- Commercial IBM licensing.
Redash
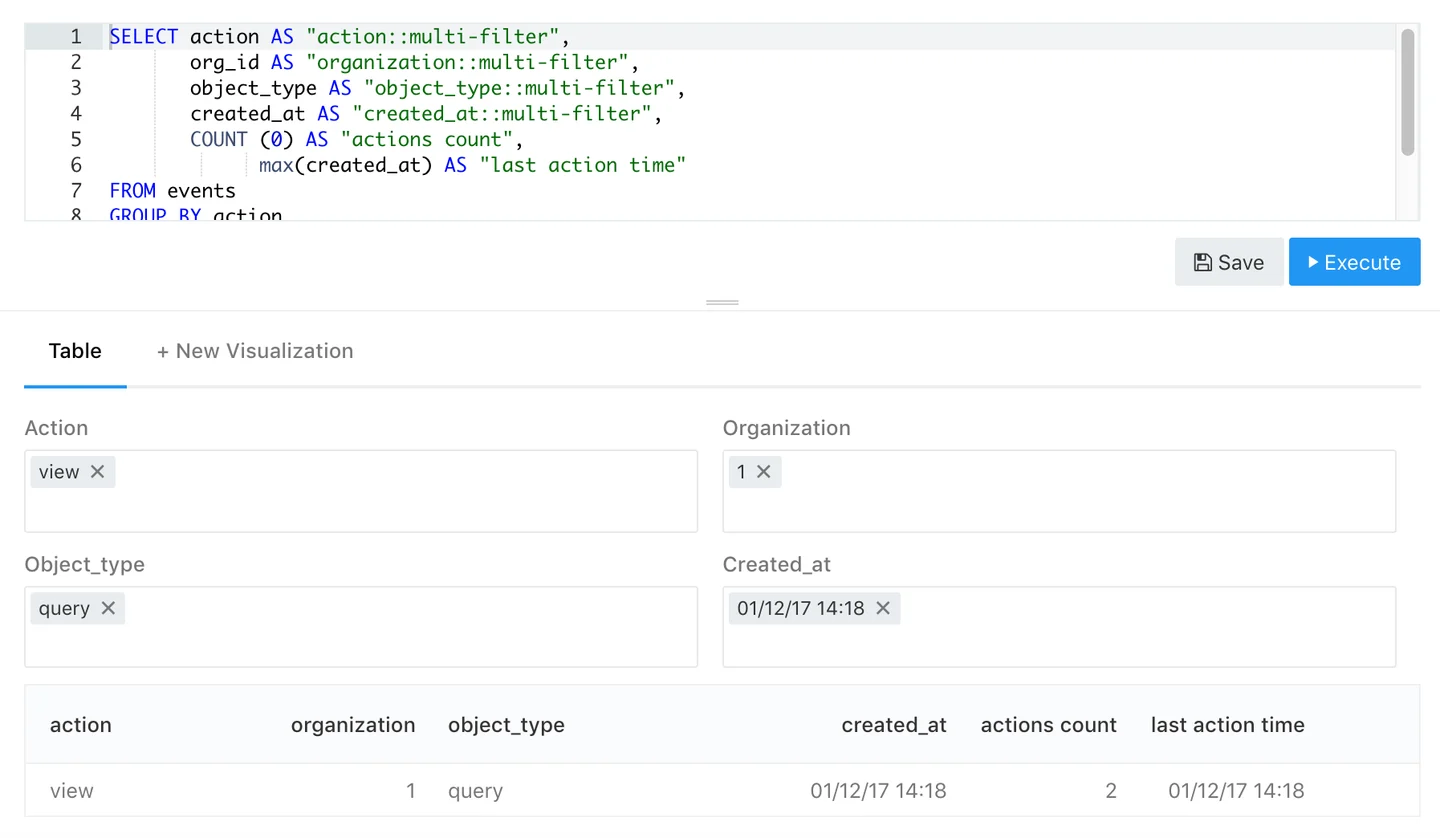
Redash connects to Microsoft SQL Server and can present charts and dashboards from saved queries. It is useful for a SQL-oriented team that wants a direct route from a query to an internal dashboard and can operate the required web services.
Its strengths are a lightweight setup for users and explicit SQL queries. The team must define data-source access, worker capacity and refresh scheduling. Retention and deployment maintenance need an owner when dashboards start serving recurring operational work.
Use the documented SQL Server data source and keep track of query, schedule and dashboard state. Record dependencies for the self-hosted Redash deployment and its specific version.
Recover the lab dashboard and test executions from the required query worker. Verify the exact values under the intended role, including whether old query results were cached.
- Compatibility
- Self-managed Redash and a supported SQL Server data source.
- License and trial
- Free, open-source software. Hosting and operations are separate.
Which self-hosted BI tools to shortlist
| What you need | Tools to shortlist | What to verify |
|---|---|---|
| SQL analysis and dashboards on your own infrastructure | Check which features authors and viewers can use, and protect the application database that stores saved dashboards. | |
| Operational dashboards that query SQL Server | Confirm variable filtering, query access and retention of dashboard and data source settings. | |
| A managed publishing process inside your own environment | Verify the connector, live or extract workflow, viewer entitlements and the recovery steps for the deployed edition. |
Identify which dashboard state must survive a server loss
Inventory application metadata, dashboards, queries, data models, connection setup, users and roles. Protect any keys required for restored connections through approved secret handling. Name the SQL Server warehouse separately so restoring dashboard content can be tested without copying operational database data.
Compare deployments using the same roles and small data set. Record which team patches the app, restores the metadata and checks subscriptions or refresh jobs. Keep the old and recovered permissions visible in the test evidence.
Saved SQL queries and dashboards
Test the BI metadata restore
Verify permissions, connection configuration and actual query results.
Provisioned operations panels and alerts
Test configuration and application state
Check alert rules, query identity and deployment files.
Published reporting and extracts
Test content recovery and refresh
Verify published objects, data paths and the age of the recovered data.
Reopen a restored dashboard and check the SQL and viewer scope
Create an approved dashboard using the two rows returned by the fixture. The authorized North scope has values 12 and 8, totaling 20. A third row for South is outside that scope. Use the intended database permissions and application access policy when setting up the dashboard.
Restore the dashboard host or metadata to an isolated instance. As the lab viewer, revisit the dataset and compare the approved values. Recheck the connection and permission boundary, and confirm a current SQL result rather than relying on cached output.
| Stage | Expected | Evidence |
|---|---|---|
| Before recovery | Known dashboard, SQL connection and scope | Snapshot of approved config and target values |
| Application restore | Dashboard and metadata are usable | New host, supported build and restored assets |
| SQL validation | North 12 and 8, with the expected total 20 | Successful current query and correct SQL source |
| Viewer permission | Approved North data only | Independent test under the intended role |
How to compare these tools
Publish the same dashboard using a scoped SQL Server login. Test refresh, viewer roles, row access, exports and the changes needed to update it after publication. Sources checked .
Test data refresh and restore one dashboard
Use this read-only SQL in an existing disposable DashboardRecoveryTrial database. Use the selected rows and total for the test dashboard. Bind the approved scope server-side and check it with the intended application role before and after restoring the host.
Verify data returned to an authorized self-hosted dashboard
T-SQL · 15 lines
- Configure the intended SQL connection and viewer controls. Save required dashboard metadata and separate connection or key dependencies in the recovery record.
- Restore to an approved alternate BI host. Open the dashboard under the viewer account and verify the expected values and region scope with a current query.
- Verify report refresh, access and any scheduled or deployed components the team requires. Record actual rebuild duration and the prerequisites still dependent on the old host.
Conclusion
Shortlist the tools whose deployment and refresh method fit your team. For the final choice, recover a working dashboard in a fresh lab and test it with a viewer account. Keep the SQL Server view, the dashboard definition and the recovery steps together so the next operator can repeat the test.
Frequently asked questions
Which self-hosted BI tools connect to SQL Server?
Metabase, Apache Superset, Grafana, Power BI Report Server, Tableau Server, Qlik Sense Enterprise on Windows, Sisense, IBM Cognos Analytics and Redash document SQL Server connections. Confirm the driver, authentication method and supported mode for the version you deploy.
Should a dashboard use live SQL Server queries or imported data?
Use live queries when the required freshness and database capacity allow them. Use imports or extracts when a scheduled snapshot fits your reporting needs. Test how quickly a known change appears and record what a viewer sees if the refresh fails.
How do I give a BI dashboard read-only access to SQL Server?
Create a dedicated user for the BI connection. Grant it SELECT on the reporting views it needs, and test the effective SQL permissions. Use the BI tool’s viewer and author permissions to control what users can do with that connection.
Does backing up SQL Server also back up the dashboard?
Back up the reporting data and the BI application state according to where each is stored. For the BI application, check the dashboards, permissions, connection metadata, encryption material and any extracts required by the product.
What should I test after restoring a self-hosted dashboard?
Sign in as a viewer, apply the expected filters, check the displayed totals, and confirm the data source connects with the intended read-only permissions. Test the scheduled refresh if it is part of the deployment.
Does backing up a SQL Server data source preserve the hosted BI dashboards?
Back up the application state that contains dashboard definitions and relevant settings. Verify saved content and restored data access with a recovery test.
What should a dashboard recovery smoke test verify?
Reopen the intended object, connect to the expected SQL source, and verify current data and role scope. Include any scheduled refresh or reporting work the dashboard relies on.