

SQL Server load tests can replay work captured from an existing system or generate new work with a known shape. Replay is useful when concurrency, query mix and timing matter during an upgrade. A synthetic benchmark is useful when a team wants repeatable transactions to compare two environments. A single-query stress test answers a narrower question about how one statement behaves under concurrency.
WorkloadTools and Benchmark Factory can help with captured work, while HammerDB provides defined benchmark workloads. sqlsimtools, JMeter and k6 can run scripted database tests. SQLQueryStress is useful for a focused query test, and YCSB emphasizes key-based patterns. A useful result depends on representative data, workload timing and metrics collected from both the client and SQL Server.
SQL Server load testing and replay tools at a glance
Pick the workload source first. A captured production-shaped replay, a benchmark and a repeated query answer different questions and produce different metrics.
| Tool | Workload type | Control to check | Driver or terms |
|---|---|---|---|
| WorkloadTools | SQL Server collection, analysis and replay | Captured sessions, timing, normalization and replay errors | Open-source tool. Verify capture source and replay runtime. |
| Quest Benchmark Factory | Vendor benchmarks and supported workload replay | Scale, virtual users, workload settings and result reports | Commercial. Check edition and capture or replay support. |
| Microsoft sqlsimtools | SQL Server load simulation and replay utilities | Pinned workload and actual SQL Server runner and driver | Check tool permissions, current release and project licensing |
| HammerDB | Defined benchmark workloads on SQL Server | Driver script, database scale, workers and run settings | Open source. Record benchmark mode and metrics. |
| SQLQueryStress | Repeat a specific T-SQL query | Concurrent workers, parameters and errors | Open source. Verify runtime and destination. |
| Apache JMeter with Microsoft JDBC | Scripted SQL requests or broader application test | Connection pooling, concurrency, sampling and CSV output | Open-source JMeter plus approved Microsoft JDBC driver |
| Grafana k6 with xk6-sql | Scripted SQL Server requests and optional related protocol checks | Selected scenarios, timings, checks and extension build | Pin k6, xk6-sql and the compatible SQL Server driver extension |
| YCSB with JDBC | Generated key-value style operations through JDBC | Read-write mix, dataset, target rate and errors | Verify JDBC binding, driver and SQL Server behavior |
WorkloadTools
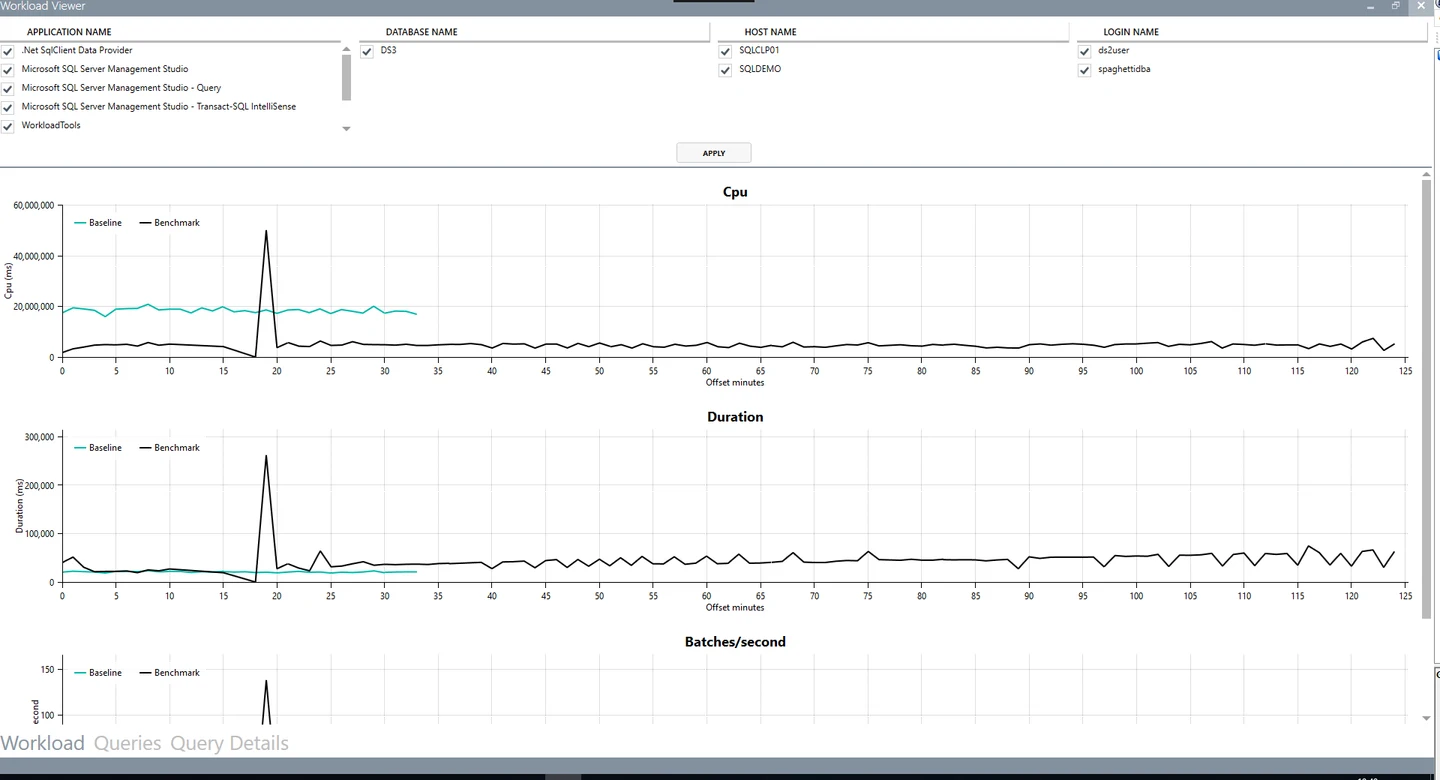
WorkloadTools collects SQL Server execution events through Extended Events or SQL Trace and routes them to components for storage, analysis or replay. It is useful when a team preparing an upgrade wants to compare a recognizable production query mix against a restored test copy.
Replay fidelity depends on what was captured, the selected events and how the target was prepared. The same queries can behave differently if the target has different data, statistics or configuration. WorkloadTools gives the team a way to collect and compare, while the DBA owns the test dataset and concurrent workload assumptions.
Use the documented collection and replay workflow for the SQL Server version and source you can reach. The capture can contain SQL text and sensitive input. Rehearse with synthetic or approved sanitized data and check that the replay target is isolated.
Capture expected counts, SQL durations and errors. Compare a replay to the original workload shape, including timing and concurrent sessions. Record skipped or unsupported statements rather than counting the whole captured trace as successfully replayed.
- Compatibility
- Supported WorkloadTools release, SQL Server permissions for capture, and a prepared replay target.
- License and trial
- Free, open-source project.
Quest Benchmark Factory for Databases
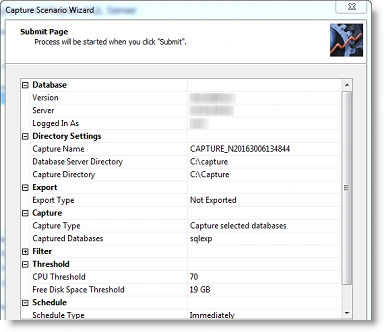
Quest Benchmark Factory offers prescribed benchmark workloads and a SQL Server capture and replay workflow. Its job structure and reporting help repeat a test and compare runs. This is useful for teams that want a commercial interface to configure a workload and review how it behaved on different systems.
It fits an upgrade or capacity test where the operator wants the commercial runner and a repeatable setup. The supported capture source and replay settings determine what can be reproduced. Multiple runs also need a controlled test starting state when the workload changes data.
Use the installed Quest edition and a SQL Server connection supported by its current guide. Record the benchmark profile, database scale, run interval and configured virtual users. Verify whether your planned replay input is supported separately.
Run two equivalent scenarios and export the results. Compare successful transactions, measured latency and failed requests across load steps. Record any setup or preparation time outside the measured interval.
- Compatibility
- Supported Benchmark Factory version, capture configuration and SQL Server targets.
- License and trial
- Commercial Quest licensing.
sqlsimtools
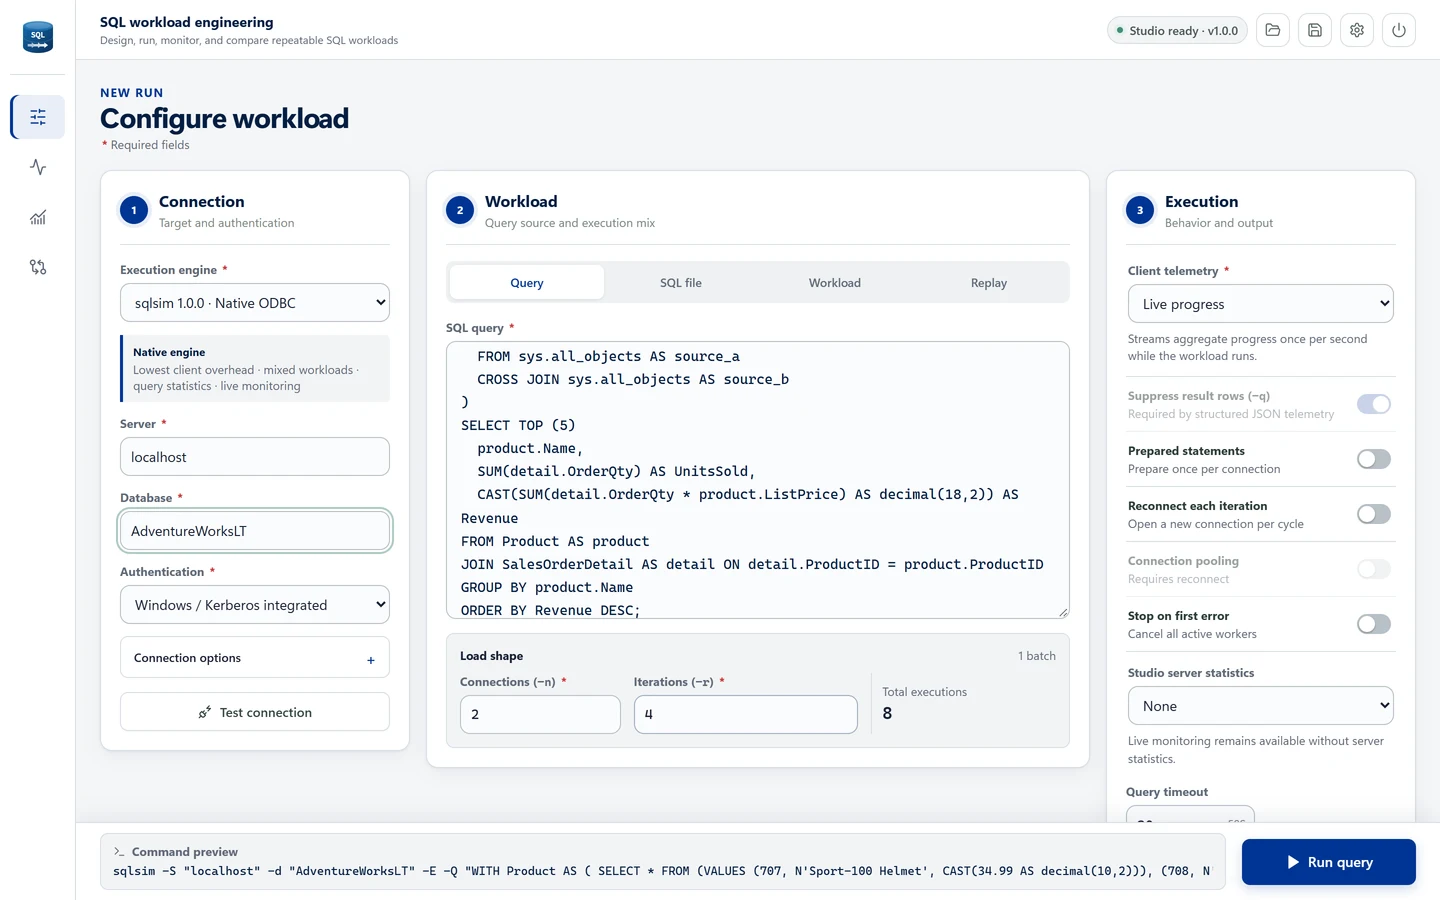
Microsoft’s sqlsimtools includes a native C++ and ODBC workload runner, a Python-based workflow and a local browser interface. The tools can run concurrent scripts and support replay workflows. That is useful when a team wants to explore a load visually and move the same experiment into automation where supported.
It fits experiments organized around a specified SQL workload and measured concurrency. The chosen component, driver and connection mode can affect the result. A workload that repeats the same commands reliably still depends on a realistic database, the right client count and clear baseline metrics.
Microsoft documents a set of tools for load simulation and replay. Select the actual runner and driver used in the test and record release and operating system. Validate the expected row output before adding parallel clients.
Use an approved workload and compare query and error results across two runs. Keep the captured or generated script with the driver settings. Distinguish client-side pacing from observed SQL Server throughput.
- Compatibility
- Supported sqlsimtools component and SQL Server driver or connection. Host support depends on the selected runner.
- License and trial
- Open-source Microsoft project.
HammerDB
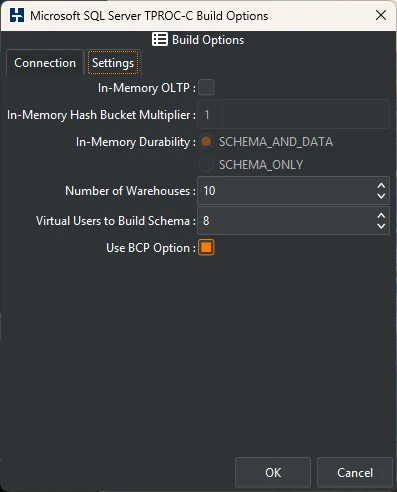
HammerDB generates supported database benchmark workloads such as TPROC-C for SQL Server. It can build a benchmark schema and run predefined transactions with virtual users. This is useful when a team needs a repeatable comparison of throughput or capacity using the same synthetic workload.
Its strength is holding the generated workload constant while changing the environment or configuration. A standard workload has its own data shape, transaction mix and scaling behavior. Results can compare two controlled runs, while an application rollout still benefits from an experiment based on the application’s SQL and data.
Pick a documented SQL Server workload and database scale, then record virtual users and the run schedule. Configure the same initial schema and dataset for both trials. Start collecting results after the defined warmup.
Keep the benchmark's own result metric and units with the output. Compare results under the same workload and hardware. Add SQL Server waits and storage signals to determine what limited the measured run.
- Compatibility
- HammerDB with compatible SQL Server driver, target and benchmark setup.
- License and trial
- Free and open source.
SQLQueryStress
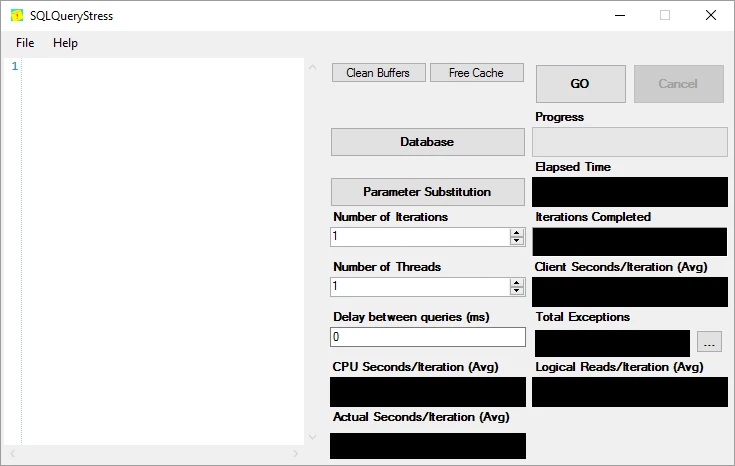
SQLQueryStress repeatedly executes a specified SQL Server query with configurable threads and iterations. It captures measurements such as client execution time and can gather SQL Server statistics for a run. It is useful when a DBA wants to see whether one query stays predictable as callers are added.
It fits a narrow experiment around a statement, procedure or parameterized call. Repetition can expose lock contention or an unstable query, while it covers a smaller workload mix than captured replay. Setup choices such as parameters and the data state can substantially change what a run measures.
Start with the exact query and bind the same parameter distribution for each test. Compare concurrent workers and iterations with the observed query counts and failures. Use a verified disposable SQL Server connection.
For the fixture, verify the tenant subtotal before starting concurrent traffic. Collect response times and database metrics in parallel. Avoid extrapolating from one stress query to the application's full production load.
- Compatibility
- Windows SQLQueryStress and a supported SQL Server connection.
- License and trial
- Free, open-source tool.
Apache JMeter with the Microsoft JDBC driver
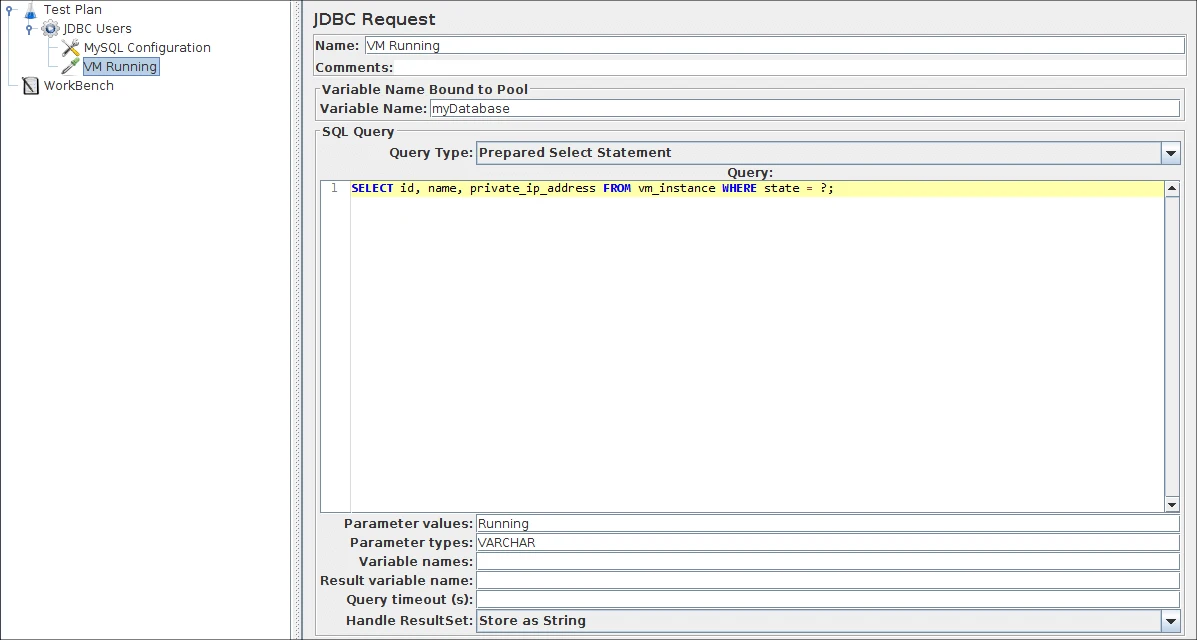
Apache JMeter runs JDBC requests through a connection pool and can coordinate them with thread groups, timers and assertions. With Microsoft’s JDBC driver it can send a defined workload to SQL Server. This is useful when the same team wants database or application-level tests in a familiar runner.
Its strength is repeatable scripts and configurable concurrency around multiple kinds of work. Connection pooling and timing settings change the load that reaches SQL Server. Client observations should be checked alongside engine metrics so the team can tell a pool limit from a database bottleneck.
Use the documented JDBC request with a pinned SQL Server driver and a clear connection-pool configuration. Verify the database, authentication and target size. Implement checks for expected rows or failures rather than treating any response as success.
Run outside the interactive GUI for a load comparison and retain measured sample results as required. Separate timing at the JDBC client from app request time when the plan also includes an HTTP step.
- Compatibility
- Java and JMeter with a compatible Microsoft JDBC driver and supported SQL Server connectivity.
- License and trial
- Free, open-source testing tool. Infrastructure costs are separate.
Grafana k6 with xk6-sql for SQL Server
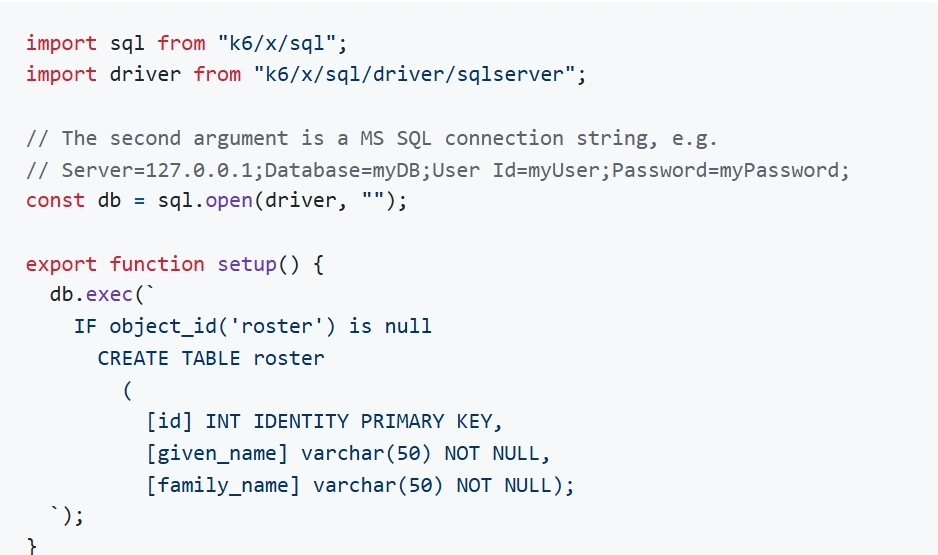
Grafana k6 can use xk6-sql and its SQL Server driver to execute SQL in scripted tests. The scripts can coordinate database requests with thresholds and other activity. This is useful for teams that already track k6 test results and want database work in the same test flow.
It fits a scripted benchmark whose maintainers can build or obtain the required extension-enabled runtime. Driver options and the script determine connection and parameter behavior. A database request measured by k6 is a client-side observation, so SQL Server still supplies the evidence about waits or resource use.
Pin xk6-sql, the SQL Server driver extension and compatible k6 versions. Establish a successful restricted connection before configuring scenarios. Capture the script and runner configuration so the test is repeatable.
Define SQL-specific latency measurements and checks. A k6 trial sending HTTP requests through the application has a different timing boundary from the driver call. Keep both sets of observations independent.
- Compatibility
- A compatible k6 runtime including xk6-sql and the SQL Server driver extension.
- License and trial
- Open-source extensions. Hosted or managed k6 use follows its separate plan.
YCSB with the JDBC binding
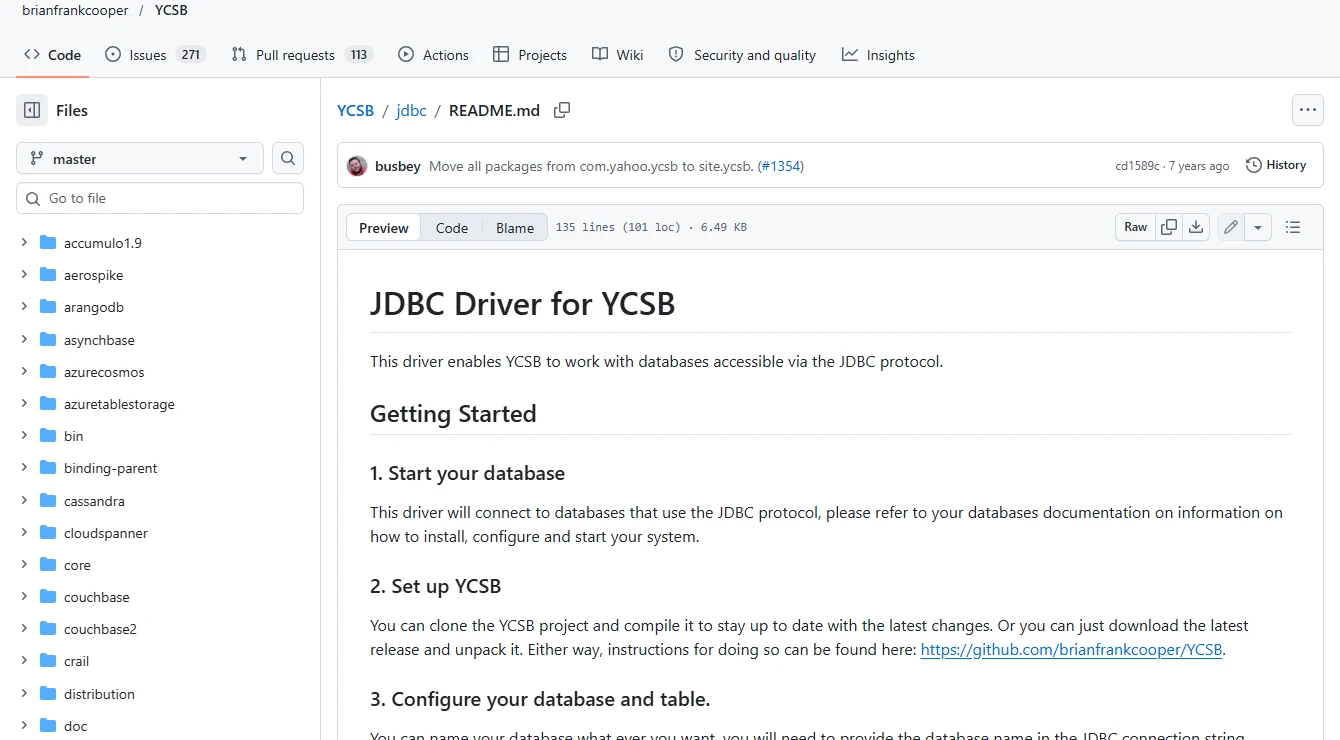
YCSB provides workload patterns such as key-based reads, inserts and updates, and a JDBC binding that can use a supported SQL Server connection. It gives engineers a repeatable workload when they want to compare how an environment handles a simple set of record operations.
Its fit is narrower than a benchmark designed around stored procedures or complex joins. Field distribution, concurrency and the schema prepared for JDBC shape the result. It is useful for comparing the same experiment across environments, while application behavior needs an appropriate workload of its own.
Use the documented JDBC binding with a SQL Server-compatible driver and schema. Keep the key distribution and operation mix explicit. A generated key-value workload is a useful bounded test of specific database behavior.
Reset the same initial dataset and verify the expected number of failed operations and actual offered load. Compare normalized throughput and timing under the same hardware. Retain a copy of the exact properties file.
- Compatibility
- Java YCSB JDBC binding and a compatible SQL Server JDBC driver and schema.
- License and trial
- Free, open-source benchmark.
Choose a SQL Server load testing tool by workload
| What you need | Tools to shortlist | What to verify |
|---|---|---|
| Capture SQL Server requests and replay them on a test target | Verify the supported capture format, timing, session order, database mappings and errors on replay. | |
| Run the same query or workload mix at increasing concurrency | Keep inputs, connection settings, ramp-up, driver and duration consistent. Check completed operations and failures. | |
| Run a repeatable database benchmark or JDBC workload | Keep schema scale, operation mix, client resources and run length fixed when you repeat the benchmark. |
Choose a recorded replay or a controlled generated load
Use replay when original query mix and timing drive the test. Use a generated workload when the goal is to isolate one type of work or repeat a benchmark. Check which queries executed, which failed and which could not be reproduced.
The shape of a recorded workload
Capture and replay an approved subset
Preserve timing and concurrency where possible, and protect captured text and values.
A known query or transaction under concurrent clients
Generate a reproducible load
Pin parameters, concurrency, duration and driver settings.
Traffic through an application
Measure application and SQL timing separately
Record which layer initialized, waited, timed out or failed.
- WorkloadTools SQL Server capture and replay
- Quest Benchmark Factory user guide
- Microsoft sqlsimtools load and workload replay
- HammerDB benchmark documentation
- SQLQueryStress documentation
- Apache JMeter JDBC request and listener reference
- Grafana xk6-sql module
- Grafana k6 SQL Server driver extension
- YCSB JDBC database binding
- Microsoft Distributed Replay lifecycle and alternatives
Measure throughput, p95 and errors after warmup
Restore the same seed or reset state between controlled runs. Record runner and SQL Server resources, versions and cache or warmup conditions. Keep total requests, errors and successful work inside the same measured interval.
Calculate successful statements per second as successes divided by measured seconds. Calculate error rate as failures divided by attempted requests. Take p95 from the latency samples of the relevant client path. Record waits and storage latency from the same interval.
| Step | Inputs to keep fixed | Measure | Compare the evidence |
|---|---|---|---|
| Warmup | Seed, parameters and initial client load | Readiness and query correctness | Keep this interval separate from the reported results |
| Baseline | Selected duration, queries and four workers | Attempts, successes, p95, errors and SQL Server metrics | Save values and raw samples |
| Ramp 1 | Same seed and measurement method with twelve workers | Successful operations per second, p95 and error rate | Compare with baseline and record waits |
| Ramp 2 | Same workload at twenty-four workers | Repeat measures and collect relevant storage or CPU signals | Plot measured values and identify a bottleneck before concluding |
How to compare these tools
Use a disposable target and keep dataset, duration and concurrency fixed across runs. Compare throughput and latency with SQL Server CPU, waits and errors, and verify which requests were actually replayed. Sources checked .
Run a repeatable SQL Server read and write test
Use an empty SqlLoadTrial database. First verify the seeded query is correct. Then run the same SELECT from each tool with a scripted warmup and measured load steps.
Seed a deterministic SQL Server load test and verify the query
T-SQL · 22 lines
- Create the lab table once. Check that tenant 7 contains 100 rows totaling 250.00. Reuse the same query and parameter distribution for every comparison.
- Capture a distinct warmup and then run four, twelve and twenty-four workers for equal measurement windows. Record elapsed time, successful operations, errors and latency samples at the client. Check SQL Server waits and reads from the same interval.
- Compare sessions on equivalent infrastructure and plot only measured values. Report whether requests timed out, returned bad rows or were skipped by the test harness.
Conclusion
Pick the tool that reproduces the traffic you need to test. Save the workload definition and connection settings. Compare throughput, latency and errors from the same measurement window, with the same data and driver. Keep enough output to explain missing operations.
Frequently asked questions
What is the difference between load testing and SQL Server workload replay?
A load test generates SQL from a script or benchmark. A replay tool consumes captured SQL activity and can preserve parts of its original order or timing. Test replay fidelity with a known capture.
Can I compare the throughput numbers from different SQL Server benchmarks?
Use matching benchmark versions, schemas, scale, transaction mix, client settings and measurement windows. HammerDB’s TPROC-C numbers are for its workload. Compare the same test definition across environments.
Which tools can repeat a single T-SQL query concurrently?
SQLQueryStress, sqlsimtools, Apache JMeter with JDBC, and Grafana k6 with its SQL Server driver can generate repeated query traffic. Check how each manages sessions, timeouts and parameter input.
Which metrics should I record in a SQL Server load test?
Record completed operations per second, latency percentiles when available, and errors. Also record SQL Server CPU, waits and I/O for the same window. Check whether the client host or connection pool limits the load.
Is Microsoft SQL Server Distributed Replay still a current starting point?
Microsoft marks Distributed Replay deprecated as of SQL Server 2022 and RML Utilities deprecated as of October 2025. Confirm the available components on your engine and choose a replay workflow with documented coverage for your test target.
Can the same p95 latency represent different SQL Server load results?
Yes. Compare how the timing was measured, the number of successful requests and error rates. Distinguish client or application response time from SQL Server query duration and check that the workload mixes match.