

A query regression can follow a different execution plan, a change in parameter values or a shift in the work competing for server resources. A single plan is only one observation. Tracking regressions means comparing query identity, plan and runtime across a period where the application changed or the complaint appeared.
Query Store records that history inside SQL Server. External monitors collect their own query statistics and can put a plan change next to waits, deployment events or activity on other databases. The useful comparison is which executions become visible, how long the evidence remains, and what the tool can show when the same query is slow with the same plan.
SQL Server query plan regression tools at a glance
Compare the data each product stores and how it identifies a query in the database. An alert and a verified plan regression require different evidence.
| Tool | Primary evidence | What to verify | Deployment or licensing |
|---|---|---|---|
| Microsoft Query Store | Query ID, plan ID and aggregated database runtime intervals | Capture mode, context settings, retention and weighted comparison | Built into supported SQL Server releases; check permissions and database settings |
| Redgate Monitor | Top-query and historical metrics with relevant plan evidence | Selected database, query identity, collection scope and available plan changes | Commercial. Check configured retention, alerts and edition. |
| SolarWinds SQL Sentry | Historical query evidence and integrated plan investigation | Top SQL collection, matching plan artifacts and timing | Commercial monitoring with integrated Plan Explorer workflow |
| Quest Foglight SQL Performance Investigator | SQL workload and investigation views | Query or plan history, SQL Server target, licensed collection and retention | Commercial. Check applicable Foglight SQL monitoring setup. |
| DBmarlin | SQL statement activity and database context over time | Available SQL Server plan details, chart resolution and alert correlation | Check deployment and pricing for monitored instances |
| SQLGrease | SQL Server query performance and saved evidence where configured | Timeline, sampling, permissions, query details and notification behavior | Check commercial plan and collector setup |
| Datadog Database Monitoring | Sampled SQL and normalized query metrics | SQL Server plan samples, retention and trace or workload correlation | Hosted monitoring. Configure agent and check pricing and data handling. |
| SoftTree SQL Assistant Query Store Explorer | View and work with Query Store data from a client | Supported SQL Server release, retained windows and mitigation permissions | Commercial client. Query Store still needs to capture the evidence. |
Microsoft Query Store
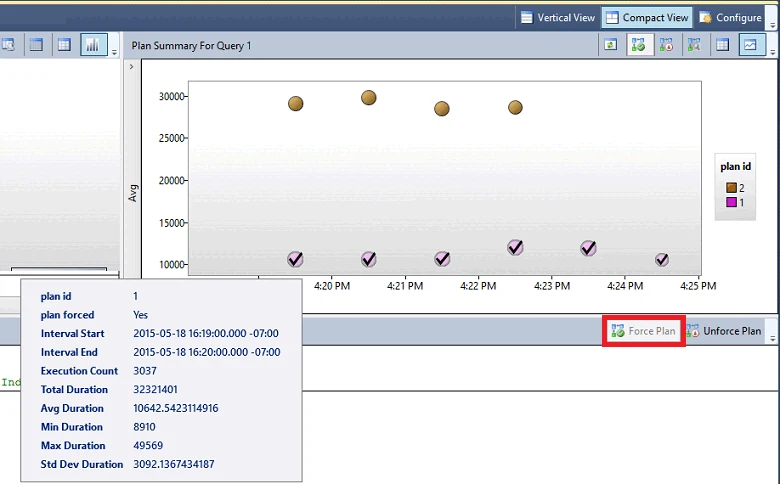
Query Store persists SQL statements, execution plans and aggregated runtime statistics inside each SQL Server database. Its regressed queries report can show the plans observed in different time windows. It is useful for tying a performance change to a specific query and plan after an upgrade or deployment.
Plan forcing is available when conditions support it, which gives a DBA a short path to restore a known execution strategy while investigating. Capture mode, storage limits and retention determine whether the relevant executions are still represented. The runtime history is aggregated by interval, so it cannot reconstruct every individual run.
Identify query_id and context_settings_id before comparing plan_id values. Query Store stores interval aggregates rather than a per-run actual plan for every execution. Check capture mode, space and interval settings before blaming missing evidence on the engine.
Compare weighted duration and reads per execution across comparable workload windows. Record execution totals as well as averages. Test a mitigation only in the intended database context and record and later remove a temporary forcing decision if the drill used one.
- Compatibility
- SQL Server 2016 and later and applicable Azure SQL targets. Availability and default settings vary by version.
- License and trial
- Built into supported SQL database engines.
Redgate Monitor
Redgate Monitor collects significant SQL Server requests and presents them in Top Queries with metrics and available plan details. This is useful when a DBA needs to compare a slow statement with what else was happening on the instance during the reported incident.
Its advantage is putting query evidence beside the wider server timeline. Collection depends on the relevant dynamic management views and the configuration of monitored servers. A query that falls below the collection criteria or disappears before a snapshot can leave gaps in the history.
Select the affected SQL Server instance, database and time range in Top Queries. Verify how the selected metrics and plan data were collected. Compare the strongest incident window with a comparable baseline rather than a single chart point.
Save the candidate plan evidence with query text and relevant workload context. Verify the configured retention and alert features. Use Query Store or another database-side source where the monitoring record lacks enough detail to identify the exact context.

- Compatibility
- Redgate Monitor with supported SQL Server connectivity and required collection permissions.
- License and trial
- Commercial monitoring license.
SolarWinds SQL Sentry
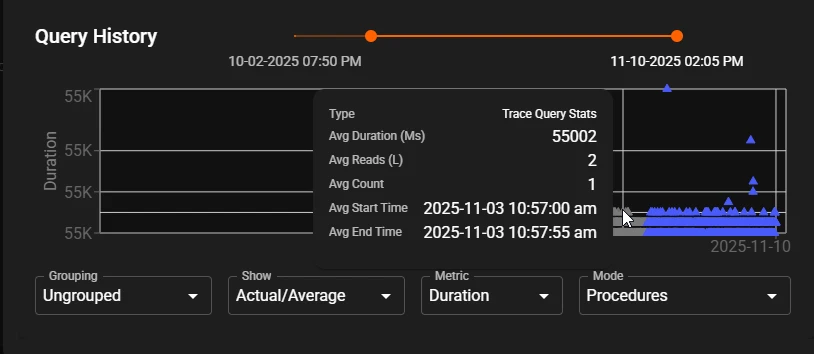
SolarWinds SQL Sentry collects Top SQL activity and can open retained plans in its integrated Plan Explorer. Its documented plan history tracks estimated plans collected at execution time. This is useful when the operator needs to examine a plan change next to instance workload and waits.
Its strength is following monitored queries across a wider incident investigation. Collection thresholds and retention affect which statements appear. A saved plan shows the compiled strategy, while collected duration, CPU and waits supply separate runtime evidence for the selected period.
Use the integrated plan analysis workflow with a retained SQL Server query sample. Check what Top SQL captured before relying on its plan view. Record the collection threshold and whether the relevant parameter context is available.
Compare the timeline with engine state and workload changes. Use the same database and statement when reviewing a second plan. Keep an export or ticket record of metrics and plan differences that another engineer can inspect.
- Compatibility
- SQL Sentry monitoring with SQL Server permissions and the applicable client or portal features.
- License and trial
- Commercial SQL Sentry licensing.
Quest Foglight SQL Performance Investigator
Quest Foglight SQL Performance Investigator collects workload history and lets a DBA investigate statements alongside performance dimensions such as waits. It can expose plan information for supported samples. This is useful when a team already uses Foglight and needs to trace a slowdown within a larger database estate.
The benefit is filtering the incident down to the relevant statement, host or period. Plan availability depends on the SQL PI collection configuration and the way the query or procedure was executed. Wait changes can help explain a slowdown even when the available plans look similar.
Start with the SQL Server-specific SQL Performance Investigator path licensed for the estate. Use the time range and database dimensions to isolate the query evidence. Verify the resolution, collection mode and retention for the relevant metrics.
Check whether a plan detail and workload information are both retained at the time of a suspected regression. Save the evidence for another operator, and verify mitigation using the SQL Server-supported workflow when needed.
- Compatibility
- Foglight for SQL Server with the SQL Performance Investigator capability configured.
- License and trial
- Commercial Quest product. SQL PI availability depends on deployment and entitlement.
DBmarlin
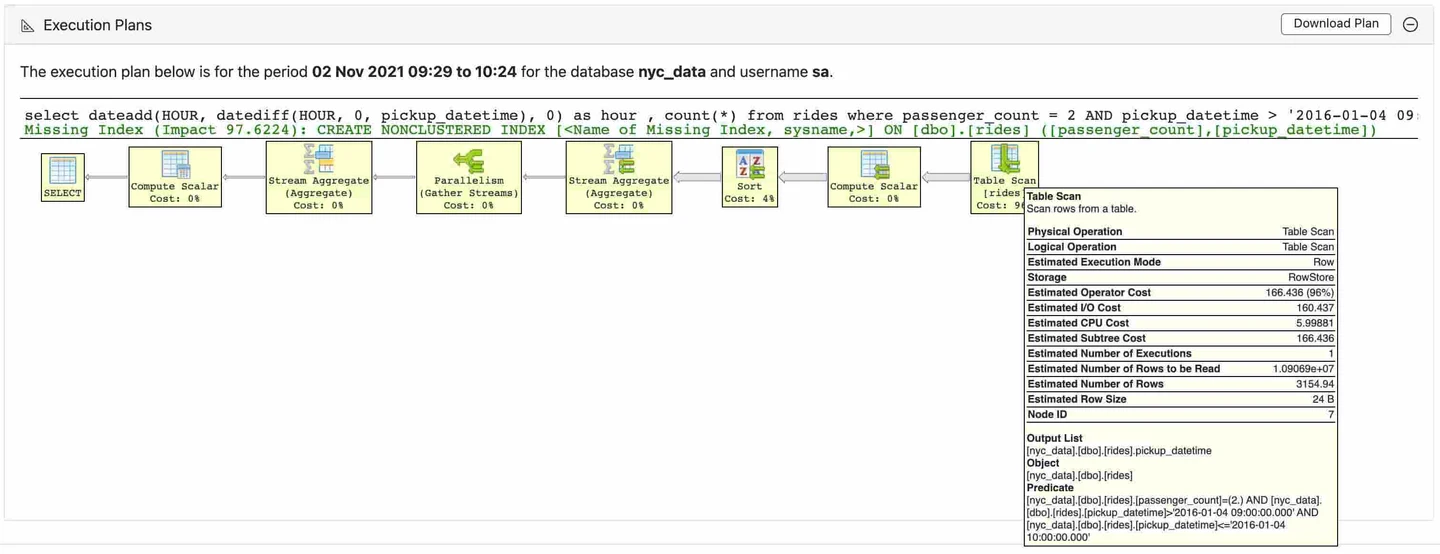
DBmarlin’s SQL view shows the statement text, available execution plans and performance details for a selected period. It can help a team connect a change in query behavior with differences observed in the execution plan. The tool is relevant when several database engines share the same incident workflow.
It fits teams that want query analysis without changing applications. The sensor and engine determine which plans can be collected, and historical evidence starts with the data DBmarlin has captured. If the plan remains stable, the time series and waits still matter to the diagnosis.
Open the SQL statement view for the affected interval and check which database and normalized statement it identifies. Inspect database-specific plan details and compare the sample against Query Store when available.
Review background workload and deployment events within the same observation window. Check which alerts fire for the intended query and whether retained detail is sufficient to distinguish larger traffic from slower executions.
- Compatibility
- DBmarlin with a configured SQL Server sensor and appropriate query monitoring permissions.
- License and trial
- Edition and usage terms depend on the DBmarlin deployment.
SQLGrease
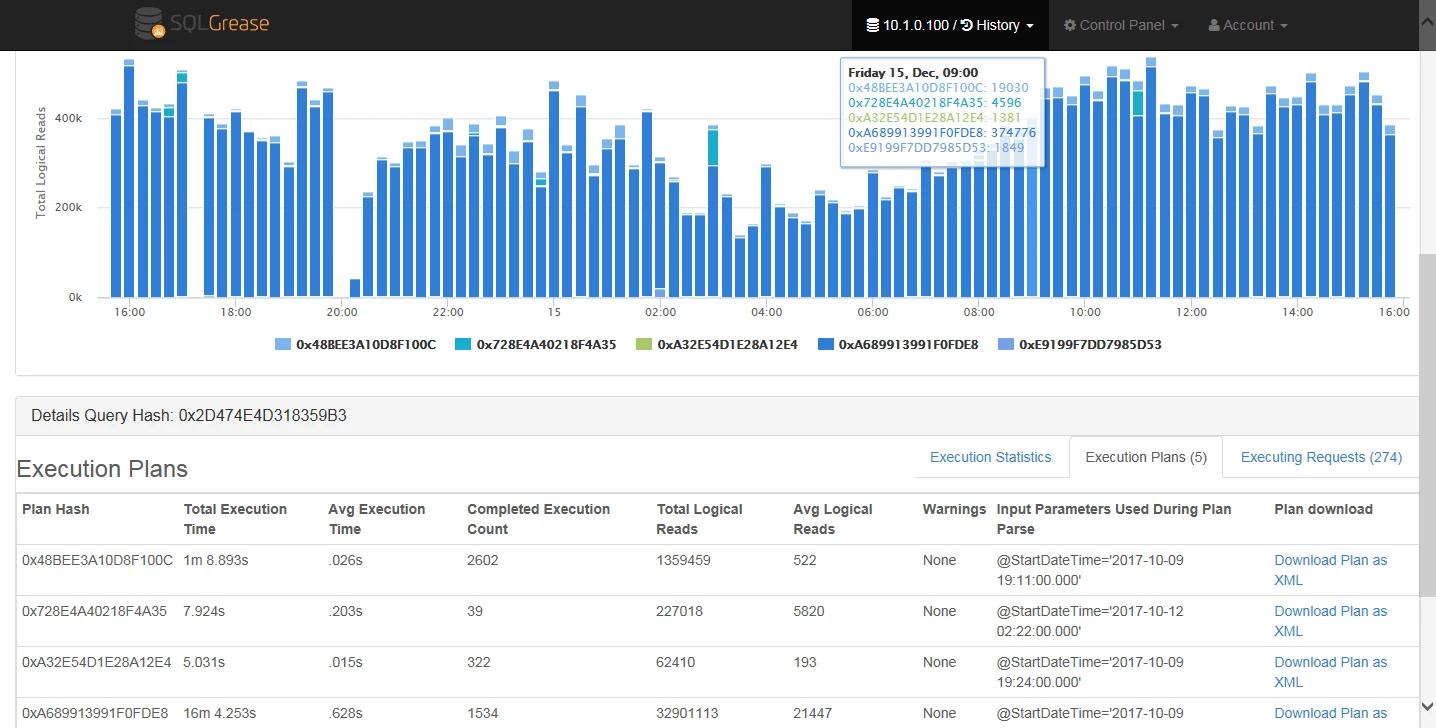
SQLGrease keeps query execution plans with performance measures such as CPU, elapsed time and reads. That makes it useful for inspecting whether an execution strategy changed when a frequently run statement got slower. The publisher also documents plan-guide generation from a known plan.
The focused query history helps an operator examine a specific regression without searching broad system dashboards first. A plan guide is an additional change to manage, with compatibility and workload considerations. The history is also limited to what the service had permission and opportunity to collect.
Configure a SQL Server collection scope with enough permissions and retention for the incident window. Use a historical query and plan investigation to compare a clear baseline with a suspected regression. Record what was actually captured.
Test whether the notification arrives when expected and which query details can be exported. Compare metrics with a database-side control and observe whether parameter mix or missing samples explain part of the difference.
- Compatibility
- SQLGrease with a supported SQL Server connection and monitoring permissions.
- License and trial
- Commercial monitoring plans.
Datadog Database Monitoring
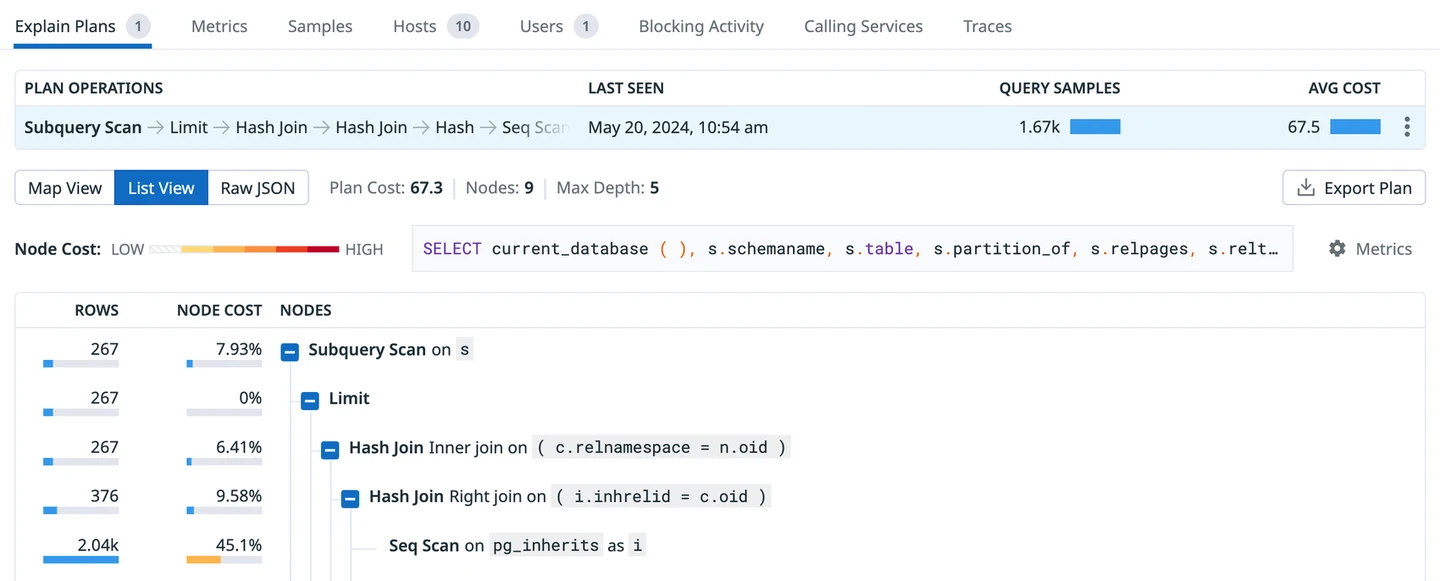
Datadog Database Monitoring collects normalized SQL Server query metrics and can associate execution evidence with sampled statements. It is useful when application traces and infrastructure signals are already in Datadog and the team wants the database investigation in that same timeline.
Its advantage is connecting database changes with wider application and host behavior. Normalized statements and samples can combine or omit execution details, so parameter-specific problems may need Query Store or a targeted capture. Available plan details depend on the collector and connection configuration.
Check agent and SQL Server integration settings before relying on the collected normalized query or available plan samples. Identify the database and source time range in the same way in Datadog and Query Store.
Use normalized query metrics and available plan samples alongside workload or trace evidence. Some executions may not supply a plan sample. Compare retention, data transfer and monitoring charges for the intended scale.
- Compatibility
- Datadog Agent with SQL Server Database Monitoring configured and required permissions.
- License and trial
- Commercial Datadog Database Monitoring and applicable infrastructure terms.
SoftTree SQL Assistant Query Store Explorer
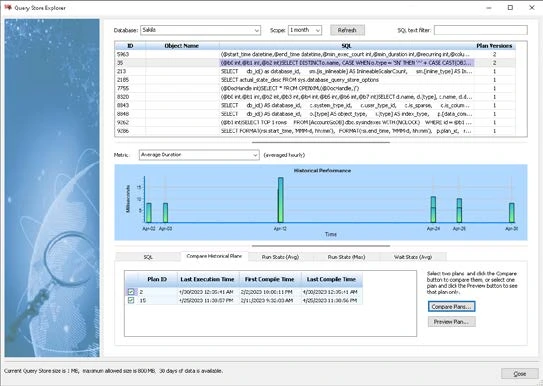
SoftTree SQL Assistant provides a Query Store Explorer that surfaces historical SQL Server query performance and graphical plan comparison. It fits a developer or DBA who wants an alternative interface over data the engine already captures, especially within an editor workflow supported by SQL Assistant.
Its value is browsing and comparing the native history through another presentation. Query Store still owns the underlying coverage and retention. When the capture mode skipped the statement or the relevant history was removed, the explorer has the same gap in the source data.
Check the Query Store Explorer's applicable SQL Server and desktop support. Identify the query and plan identifiers using the underlying database data. Verify whether a role can read the necessary stats without broad privileges.
Try a lab investigation where one plan runs under a different workload context. Compare the selected windows and inspect which plan operations the product permits. Use an independently checked SQL Server baseline if the selected filter hides different executions.
- Compatibility
- Supported SQL Assistant host and a SQL Server database with Query Store data and appropriate read permissions.
- License and trial
- Commercial SQL Assistant license.
Pick a plan regression tool by what you need to retain
| What you need | Tools to shortlist | What to verify |
|---|---|---|
| Inspect plan changes in a SQL Server database | Check Query Store state, capture mode and retention. Confirm that both plans and comparable runtime windows are available. | |
| Investigate a slowdown from an estate monitor | Trace the incident to the statement and its plan history. Check which captures remain available after the original plan leaves the cache. | |
| Track plan changes beside workload and deployment activity | Verify how the tool identifies the statement, which plans it retained and whether metrics belong to each plan or to the normalized query. |
Follow the query, its plan and the workload
A changed plan is a candidate cause. Compare the same query and context, watch execution counts, and check whether per-execution cost changed. Consider workload, blocking or parameters that can change without a different plan.
Plan changed and the comparable workload slowed
Inspect both plans and runtime evidence
Check reads, row estimates, actual workload and context before mitigating.
Workload volume or parameter mix changed
Compare equivalent executions
Separate more executions or different inputs from a slower plan.
Historical evidence is missing
Configure and verify collection
Check Query Store settings or a monitor's capture policy and compare again.
- Microsoft Query Store monitoring
- Microsoft Query Store runtime stats and units
- Microsoft Query Store tuning and plan forcing
- Redgate Monitor top queries
- SolarWinds SQL Sentry integrated Plan Explorer
- Quest Foglight SQL Performance Investigator
- DBmarlin SQL view
- SQLGrease SQL Server performance data
- Datadog Database Monitoring query metrics
- SoftTree SQL Assistant
Compare Query Store intervals before and after a plan change
This example uses synthetic observations. Each window represents an interval for the same query ID and context. The sample execution counts are similar, so the per-execution duration and reads make this plan change worth investigating.
Query Store aggregates can include multiple rows for one plan and interval. Weight averages by count_executions, use the units documented for that view, and separate different execution types. The example SQL can also read one actual query ID from an enabled Query Store.
- 09:00 UTC, plan 4127 ms
- 09:15 UTC, plan 4131 ms
- 09:30 UTC, plan 57101 ms
- 09:45 UTC, plan 57108 ms
| Beginning of interval | Plan ID | Executions | Average duration | Average logical reads |
|---|---|---|---|---|
| 09:00 UTC | 41 | 96 | 27 ms | 420 |
| 09:15 UTC | 41 | 104 | 31 ms | 460 |
| 09:30 UTC | 57 | 98 | 101 ms | 1,590 |
| 09:45 UTC | 57 | 102 | 108 ms | 1,780 |
How to compare these tools
Use one representative query with two known plans. Compare how each tool identifies the slower plan and whether it preserves time, query text, duration and parameter context. Sources checked .
Capture the same query before and after a test index change
Run the example without a query ID to reproduce the illustrative intervals. On a lab database with Query Store enabled, set @QueryId to inspect that query's completed recent intervals. Record query and context IDs with the plan and actual input distribution.
Compare synthetic Query Store windows or one real query ID
T-SQL · 29 lines
- Choose the same database, query identity and context for the comparison. Check Query Store state, interval and retention first. Select two comparable time windows.
- Compare each plan's counts, average duration and reads. Look at parameters or workload types before attributing the change to the plan. Preserve the relevant plan artifacts and configuration.
- If you rehearse a mitigation, verify per-execution results and correct output under a representative load. Record and remove any temporary override in the lab, then verify what the next compilation uses.
Conclusion
Use Query Store to establish the plan history for the statement. Then check whether your monitoring tool shows the same change with enough context to investigate. Pick an alert and retention setup that keeps the earlier plan and the runtime numbers you need when someone opens the incident later.
Frequently asked questions
How do I find a query plan regression in SQL Server?
Open the Regressed Queries report in Query Store or join its query, plan and runtime statistics views. Locate the same query in the periods before and after the slowdown. Compare the plan IDs and measured duration, CPU and reads.
Does every execution plan change make a SQL Server query slower?
Plan changes can improve or reduce performance. Compare execution count and measured resource use for equivalent inputs and time windows. Check waits and concurrency when the same plan also became slower.
Does Query Store save actual execution plans?
Query Store saves compiled plans and separate aggregated runtime statistics. To inspect observed rows on individual operators, collect an actual execution plan using a supported workflow.
Can I track SQL Server query plan changes without Query Store?
Some tools collect plans and metrics independently through the plan cache or other monitoring sources. SQL Sentry, SQLGrease and Datadog document collection workflows. Check sampling, retention and plan capture prerequisites on your targets.
Can a monitoring tool force a previous SQL Server plan?
SQL Server Query Store supports forcing an eligible plan. A monitoring tool may help identify the plan or assist with a separate workflow. Verify the plan is still viable and check runtime metrics after any forcing change.
Why should Query Store interval averages be weighted by executions?
An interval with more executions contributes more information to the overall average. Weight by execution count when combining rows, and compare separate plans and runtime contexts before interpreting the resulting numbers.