

SQL Server can show the plan it expects to use before running a query. An actual plan adds runtime details from one execution, including how many rows passed through an operator and any warnings the engine recorded. A useful plan tool makes those details easy to find, especially when a row estimate is far off or the same statement behaves differently with another parameter.
SSMS and the Microsoft extension for VS Code can collect and display plans from a live session. Plan Explorer and dbForge add views that help isolate expensive operators or compare runs. Multi-database clients are convenient when the plan is part of everyday query work. Paste The Plan is useful once a plan has been captured and the question is how to share it for review.
SQL Server execution plan tools at a glance
Check whether the tool captures plans from SQL Server, opens a saved file or shares plan XML. Those actions have different permissions and data-handling requirements.
| Tool | Good starting point | Plan evidence | Host, license or data decision |
|---|---|---|---|
| SQL Server Management Studio | Capture actual or estimated plans and compare saved plans | Graphical operators, properties and saved .sqlplan | Windows SSMS. Check SHOWPLAN and query execution permissions. |
| Microsoft MSSQL extension for VS Code | Inspect a query from the SQL Server extension | Verify actual or estimated plan actions in the exact build | Free extension. Test import, comparison and export if needed. |
| SolarWinds Plan Explorer | Detailed SQL Server plan investigation | Inspect operator estimates, metrics and session evidence | Free tool. Verify Windows, exact capture path and file exchange. |
| dbForge Studio Query Profiler | Capture plans and query statistics within dbForge | Compare plan output, properties and query execution history | Check edition and authorized execution |
| JetBrains DataGrip | Inspect plans from a multi-engine client | Check tree and raw views for SQL Server | Check DataGrip license, driver and runtime data support |
| DBeaver PRO | Inspect SQL Server plans in a supported desktop workflow | Verify plan mode, raw information and saved output | Check actual edition and SQL Server driver |
| Quest Toad for SQL Server | Plan investigation in a Toad workflow | Check explain versus actual plan capabilities and evidence | Commercial. Verify build and optimizer entitlement. |
| Paste The Plan | Share a selected plan for review | Renders pasted plan XML for sharing | Web service. Use only approved plan content. |
SQL Server Management Studio
SSMS can request an estimated plan, save an actual plan from a completed execution, and compare two saved SQL Server plans offline. Its graphical view exposes estimates, actual row counts and many operator properties. It is a good starting point for identifying what changed after an index, statistics or query edit.
The plan comparison highlights changes in shape and operators, which is helpful while investigating a regression. A plan from one execution represents that execution’s inputs and conditions. For an actual plan, the statement runs with the connected account and can change data if it is a write.
Save an estimated plan and an actual plan from the same query or load both files from approved evidence. Use the plan comparison workflow for corresponding operators. Inspect output rows and relevant runtime properties before interpreting differences.
Capture SET STATISTICS IO messages with the actual query if I/O is part of the question. Keep the plan and metrics with database compatibility, parameters and engine version. Verify who can execute and view plans under the intended permissions.
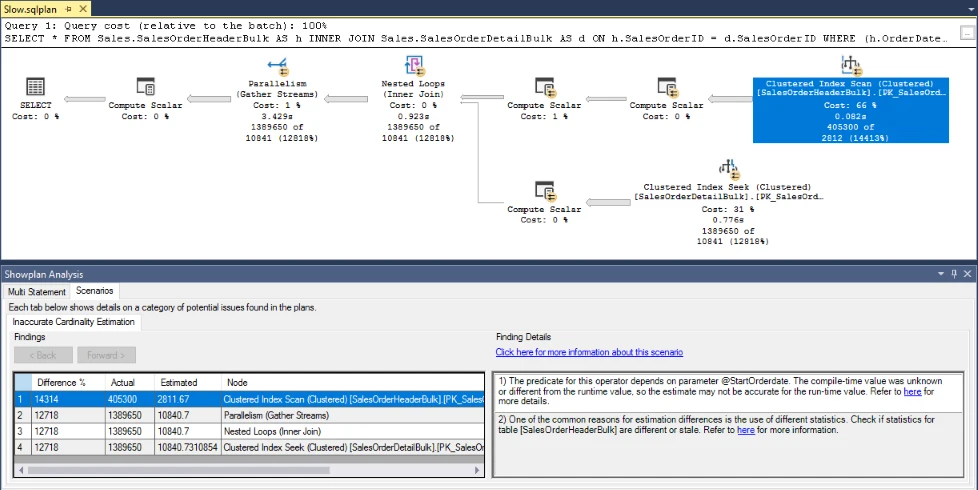
- Compatibility
- Windows SSMS with supported SQL Server or Azure SQL connectivity for live capture. Saved plans can be opened offline.
- License and trial
- Free Microsoft client.
Microsoft MSSQL extension for VS Code
The Microsoft MSSQL extension has a graphical Query Plan Visualizer for SQL Server. It can show estimated and actual plans, highlight operations by metrics such as elapsed time or rows, and expose individual node properties. This fits developers who already keep application queries and migrations open in VS Code.
It works well when editing and captured plan inspection belong in the same workspace. The separate Query Profiler uses events over a session to examine a different part of query behavior. Actual execution still needs the right permissions and a suitable target, especially if the statement writes data.
Run the documented plan command on the same SQL Server query. Confirm which action compiles only and which runs the statement. Save any generated plan file and compare it with the version produced by SSMS.
Test whether the installed extension can open and compare the artifacts your team exchanges. Record the exact version and what remains visible in the raw plan. Use a separate native review flow when a required feature is unavailable.
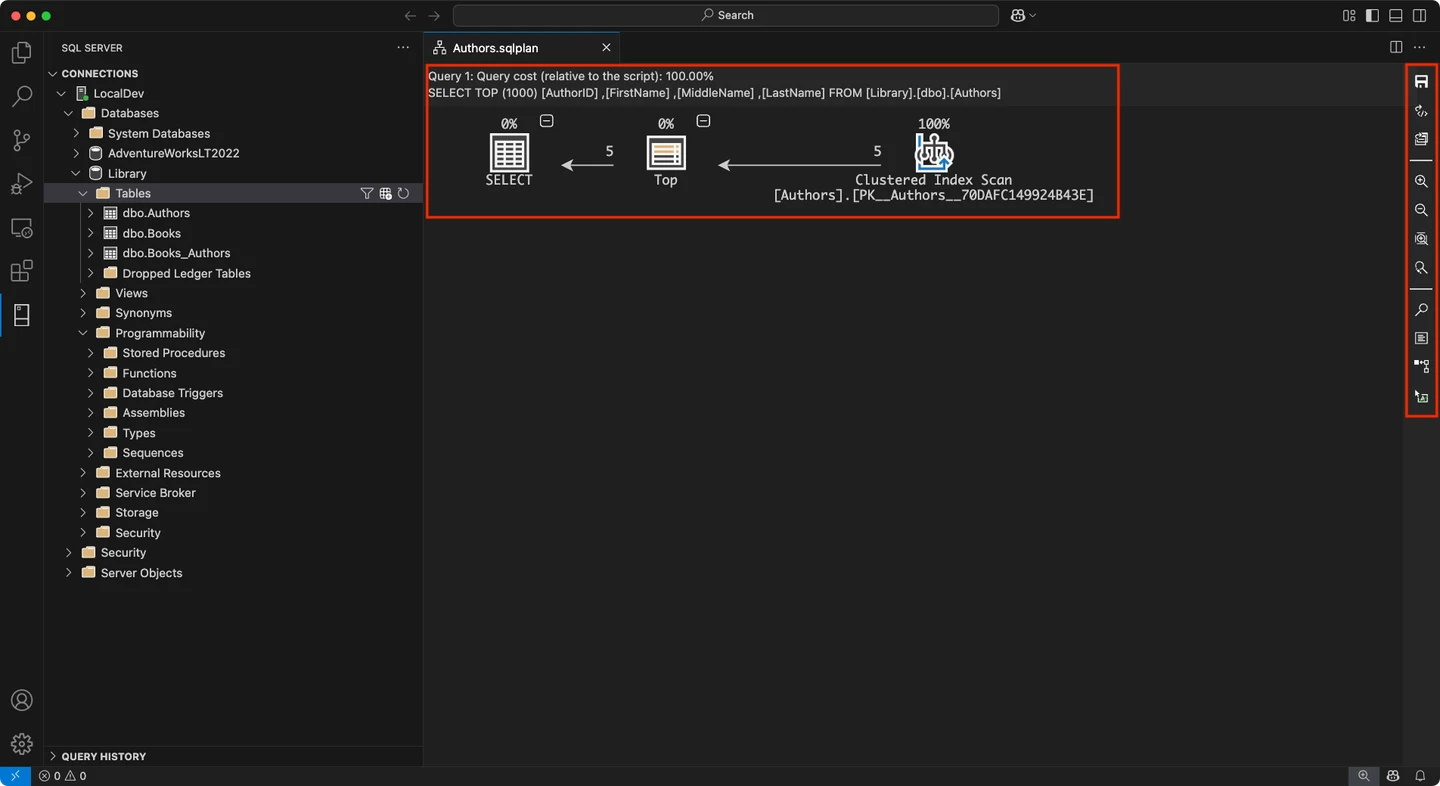
- Compatibility
- VS Code with a supported MSSQL extension version and Microsoft SQL connection.
- License and trial
- Free Microsoft extension.
SolarWinds Plan Explorer
SolarWinds Plan Explorer opens SQL Server plans and organizes operator details, statements and available runtime metrics into separate views. An actual capture can add object-level I/O and other evidence beyond the shape of the plan. It is useful when a complicated statement is difficult to navigate in the standard diagram.
The extra views are valuable for focused tuning and reviewing saved evidence. The metrics that appear depend on how the plan was collected, and requesting an actual plan runs the statements. The standalone analysis tool is useful for individual investigations, while continuous collection is a separate SQL Sentry workflow.
Open a saved SQL Server plan or use the supported capture workflow. Start at the statement summary and examine estimated versus actual rows at the relevant operators. Compare detail availability based on the capture method.
Keep actual metrics and plan parameters with the investigation. If storing a session file, confirm what it retains and who can open it. Check any redaction features on a synthetic plan before distributing an artifact.
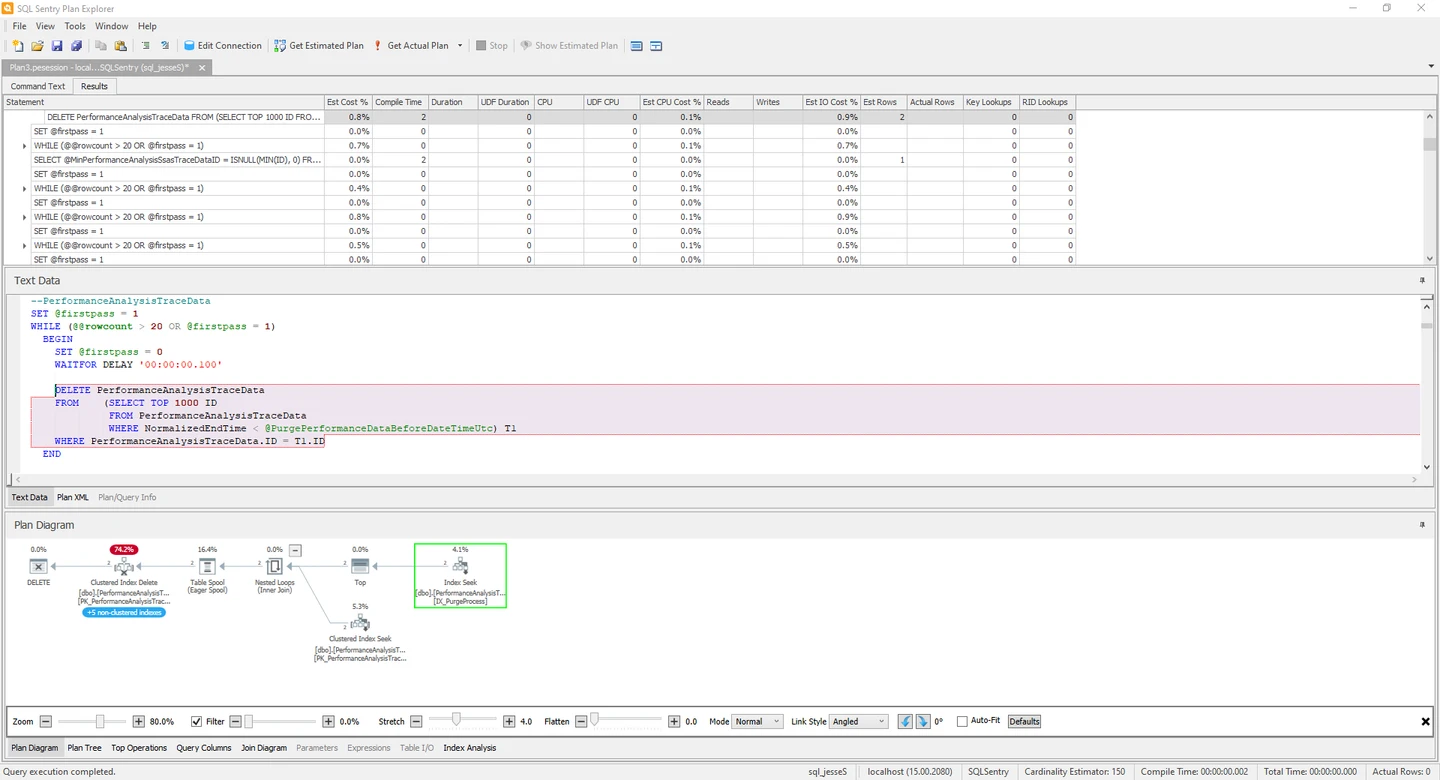
- Compatibility
- Windows Plan Explorer for supported SQL Server plans and connections.
- License and trial
- Free standalone Plan Explorer. SQL Sentry monitoring is commercial.
dbForge Studio for SQL Server Query Profiler
dbForge Studio’s Query Profiler shows SQL Server execution plans and runtime data such as reads and CPU time. A developer can compare queries and inspect both the diagram and available execution details from the same client. This is useful when tuning T-SQL is part of development alongside schema and data work.
It fits teams who want the query editor, execution statistics and plan inspection in one product. Operator estimates and top-level runtime totals answer different questions. Collecting comparable results depends on how the queries are run, including inputs, server load and the available capture permissions.
Use dbForge Query Profiler to record one lab execution and inspect the plan and statistics exposed by the installed edition. Match the statement and inputs to the SSMS result. Check when the profiler actually executes the query.
Work through both predicates in the fixture and save the output in the format your team reviews. Compare observed read counts with the plan view. Verify how the product reports available runtime information and warnings.
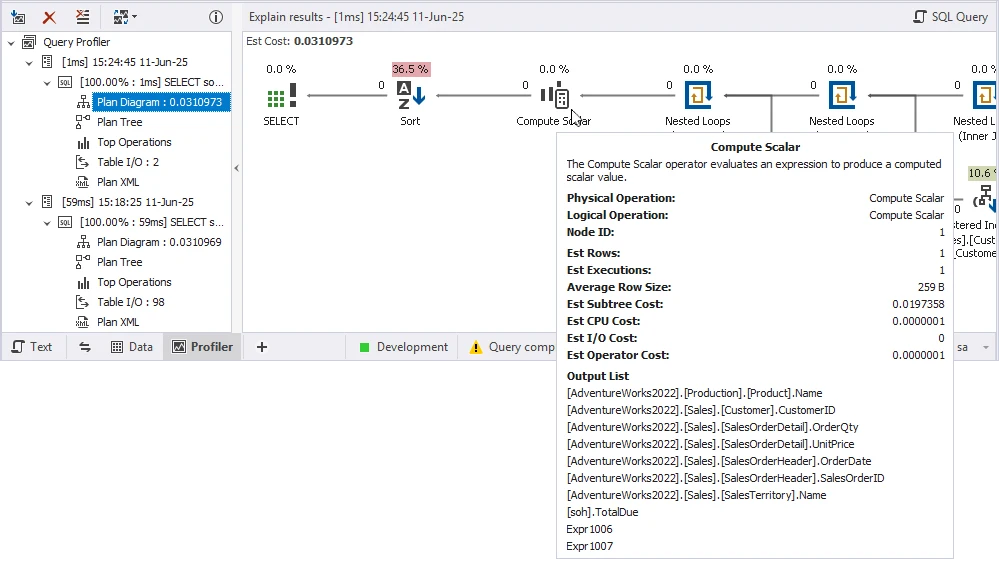
- Compatibility
- dbForge Studio for SQL Server with a supported engine, host and edition.
- License and trial
- Commercial profiling capabilities depend on the Devart edition.
JetBrains DataGrip
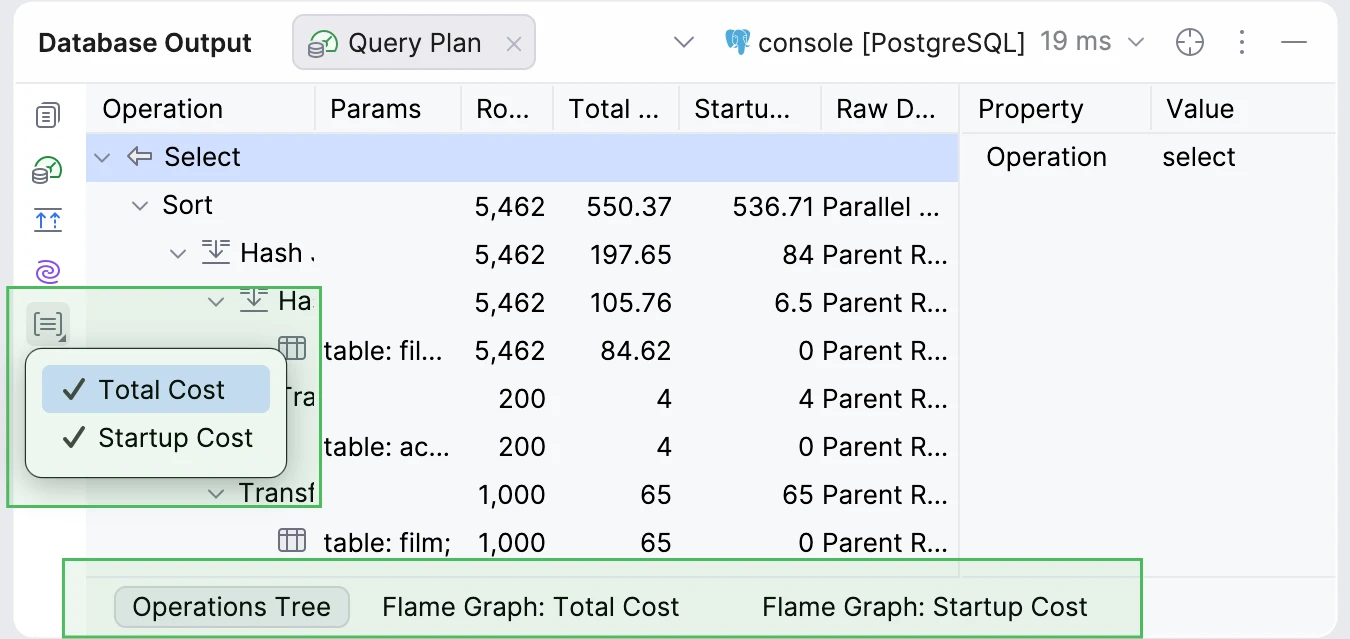
DataGrip can visualize plans using the connected database’s supported explain operation. This gives a developer a quick way to see the SQL Server optimizer’s proposed operations alongside a query or repository file. It is useful when the same developer works across multiple database engines.
Its strength is putting plan inspection close to the code. Explain and Explain Analyse depend on what the database supports, so the kind of measurements available can differ by connection. SQL Server work that needs a saved actual plan and detailed operator timings may call for a second capture workflow.
Use the SQL Server data source's plan options and compare tree and raw evidence. Verify SQL Server-specific metrics for the selected command instead of assuming every engine's plan feature provides them.
Reopen a previously saved artifact if offline review matters to the purchase. Check that operators, values and warnings can be handed to someone using another tool. Retain the original SQL and execution context separately.
- Compatibility
- DataGrip with the supported SQL Server JDBC connection. Plan options depend on the target.
- License and trial
- Free for qualifying non-commercial use. Commercial use requires an eligible license.
DBeaver PRO
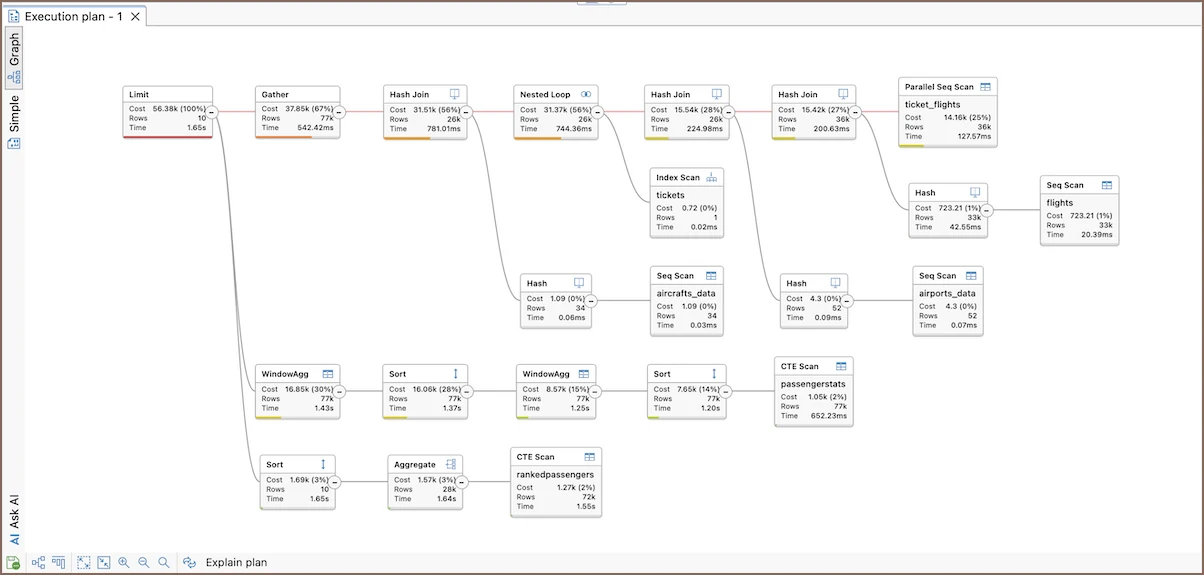
DBeaver can show a SQL Server execution plan with connected operations and available node properties. Its documentation describes estimates such as cost and row count in the graph. It is useful for initial query review by a team that already uses DBeaver as a multi-database client.
The graph helps locate operations worth inspecting even when the team works across engines. Database drivers and editions affect what the client can collect and show. Estimated rows and costs provide optimizer context, while measurements from a specific execution need a corresponding runtime capture.
Use the documented plan feature in the installed DBeaver edition. Identify which SQL Server plan command is sent for the chosen connection and whether the query runs. Open the result under the intended permissions.
Compare both queries and, when possible, export the plan artifact for review. Check the raw evidence before attributing a slowdown to the visualization. Track engine and driver support with the recorded results.
- Compatibility
- Supported DBeaver desktop edition and SQL Server JDBC connection.
- License and trial
- Execution-plan features are edition- and engine-dependent.
Quest Toad for SQL Server
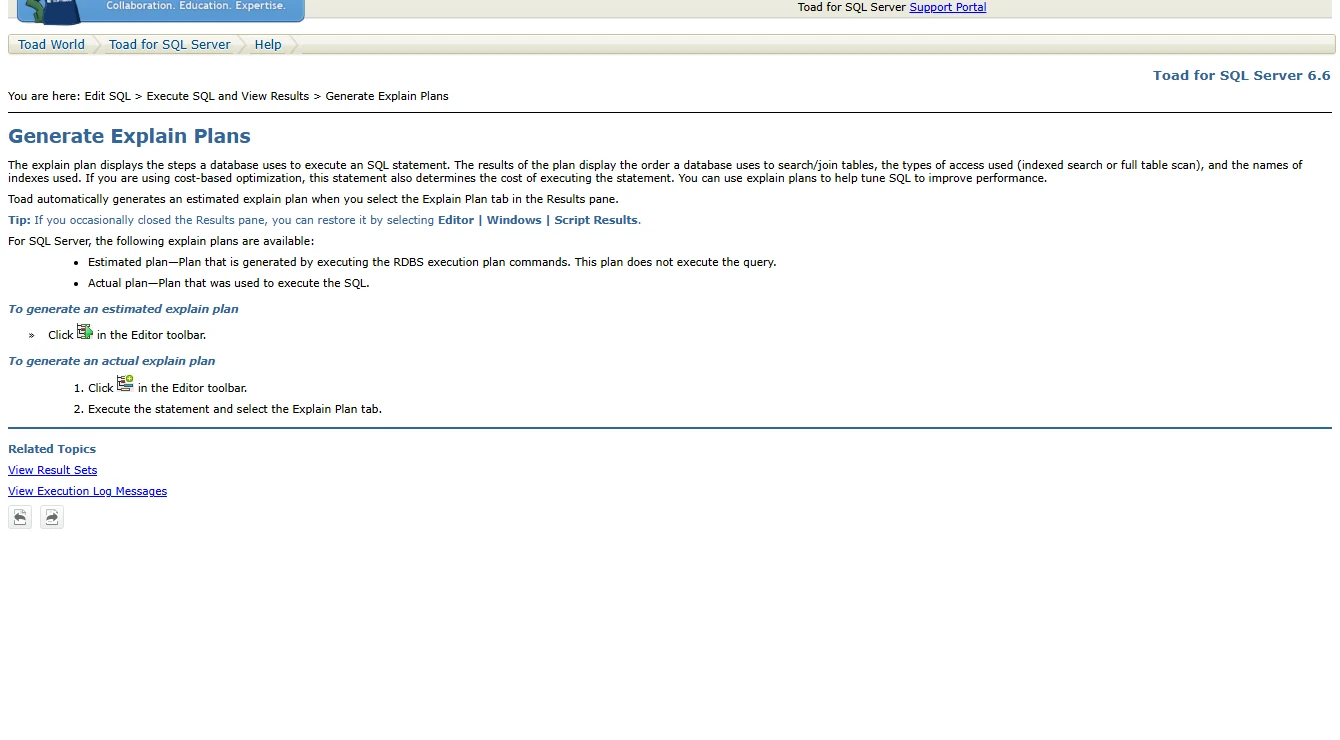
Quest Toad for SQL Server can generate and display query plans inside its editor workflow. A developer can inspect how the optimizer intends to execute an edited query and use the documented actual-plan workflow when runtime evidence is required. It fits teams that already author and troubleshoot SQL in Toad.
The editor integration is convenient when a query can be examined in the same session. Quest documents a difference for a query that relies on a local temporary table. The separate connection used for an estimated plan may lack that table, while the actual capture executes the query in its working session.
Use the installed Toad and applicable plan workflow on the known fixture. Record whether it produced an estimated or actual plan. Check relevant bundled optimizer features separately, including how they execute queries.
Save the plan and query results that a teammate can verify. Run both predicates as authorized tests and compare the measured result. Check the viewer's presentation against SQL Server properties before choosing a remediation.
- Compatibility
- Supported Windows Toad for SQL Server version and connected database.
- License and trial
- Commercial Toad licensing. Feature availability follows the selected edition.
Paste The Plan
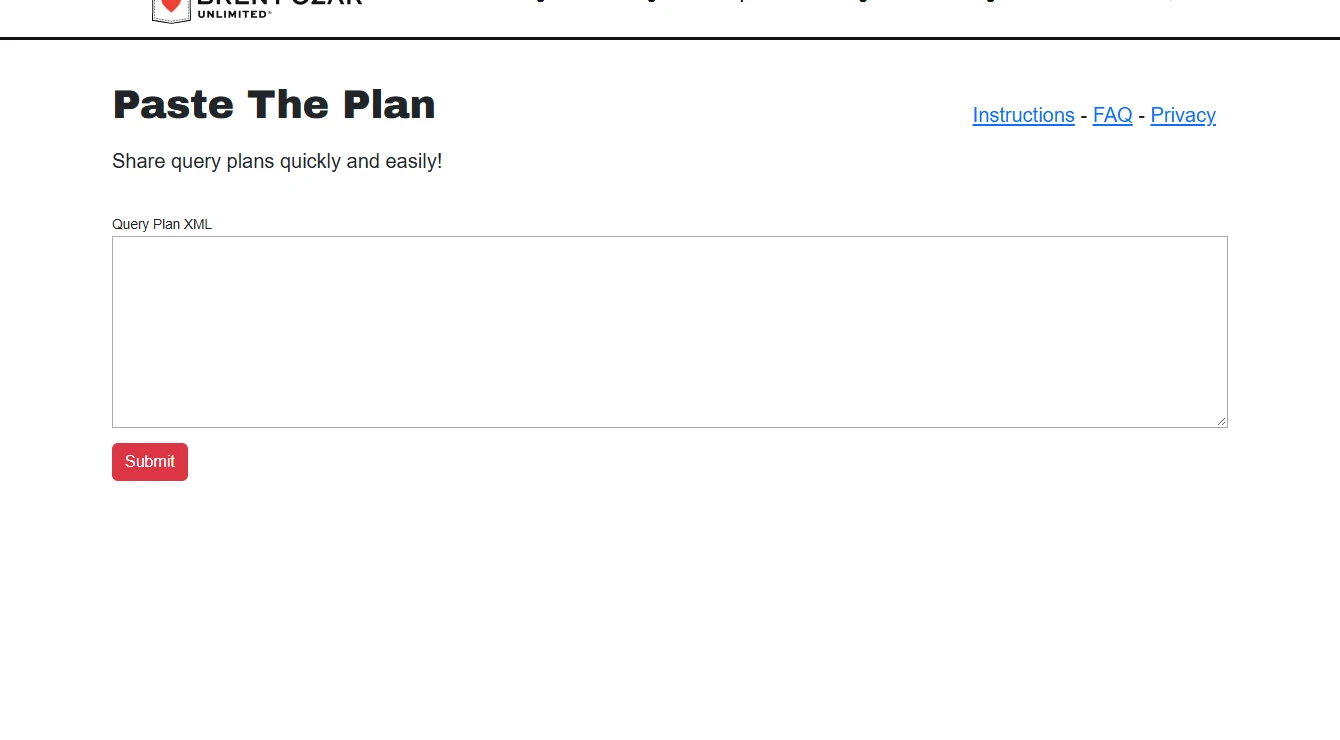
Paste The Plan opens SQL Server plan XML in a browser and provides a link another person can inspect. It is useful when a DBA or developer needs a second opinion and the reviewer has no direct access to the SQL Server that generated the plan.
Its advantage is sharing an already captured plan. Plan XML can contain query text, object names or parameter values. The plan needs to be appropriate for an external sharing service, and any sensitive fields need review before upload. The recipient can only see what the uploaded plan contains.
Use the service only for a plan whose contents are cleared for external viewing. Query text, captured values, object names and other details can appear in plan XML. Inspect the XML under the team's data-handling rules.
For a synthetic example, paste the approved XML and verify what the resulting link exposes. Keep actual execution and SQL Server permission checks in the source tool. Use an offline plan viewer when plan data can't be shared.
- Compatibility
- Browser-based viewer for supported SQL Server plan XML.
- License and trial
- Free hosted sharing tool.
Execution plan tools by workflow
| What you need | Tools to shortlist | What to verify |
|---|---|---|
| Capture actual rows and compare two plans locally | Save a .sqlplan before and after the change, then find estimated and actual rows on the same operator. | |
| Analyze a plan inside the editor | Check which tools can capture runtime statistics and which can display, copy or save the engine’s plan XML. | |
| Share a sanitized plan for review by link | Use a lab plan or review the full XML for names and values before uploading. Confirm that the link opens without the publisher’s login. |
Choose a plan capture, reviewer or sharing workflow
Use a tool that can show the evidence the investigation requires. The same plan can be compiled, captured during execution or imported later. Compare both the plan artifact and the metrics that support a decision.
A query and an authorized SQL Server connection
Capture the plan and measured reads
Separate estimated and actual plans, then record parameters and runtime properties.
A saved .sqlplan file
Compare the operators and raw XML in a viewer
Use SSMS, Plan Explorer, or an offline tool such as Performance Studio where appropriate.
A plan to share with another person
Review what the artifact exposes
Use an authorized distribution path and keep sensitive plan content local.
- Microsoft show and save SQL Server plans
- Microsoft SSMS execution-plan comparison
- Microsoft MSSQL extension plan features
- SolarWinds Plan Explorer
- SolarWinds Plan Explorer sessions
- Devart Query Profiler
- DataGrip query execution plans
- DBeaver execution-plan documentation
- Quest Toad explain plan workflow
- Brent Ozar Paste The Plan
- Erik Darling Data Performance Studio source and features
Compare two SQL Server plans for the same result
Run both forms of the date predicate on the same test data. The range is eligible for a direct range lookup on the date index, while applying a function to the column can result in different access. The chosen plan depends on the optimizer, statistics and table.
Performance Studio is an additional open-source option for saved plan analysis. Its project documents a GUI and CLI. Trial it with the same .sqlplan file and check its reported rules against native operator properties.
| Evidence | Capture | Interpretation |
|---|---|---|
| Result | 45 matching rows and total 45.00 from both queries | The comparison preserves the requested result |
| Access operator | Index seek, scan or other observed path | Use the actual chosen plan for this database |
| Cardinality | Estimated and actual rows at the relevant operator | A large gap needs context from predicates, stats or data distribution |
| Measured work | Logical reads and elapsed or CPU time in the same lab | Record observed values with parameter, engine and compatibility level |
| Runtime details | Grant, spill or wait evidence when actually present | Absence in a saved plan does not establish absence during other executions |
How to compare these tools
Capture actual plans for the same query and parameters. Check estimated versus actual rows, warnings and costly operators, and verify that the file you share omits private identifiers and values. Sources checked .
Compare two plans that must return the same rows
Use the fixture in an empty PlanAnalysisTrial database. After setup, execute both SELECT statements with actual plan capture and keep SET STATISTICS IO output. The fixture supplies expected result rows. Operator choice and reads are measurements to collect on your instance.
Compare a function predicate with a date range in SQL Server
T-SQL · 28 lines
- Set up the table and index, then run both SELECT statements with the same @ReportDate and actual-plan capture. Verify 45 rows and a total of 45.00 on each.
- Save both plan files and logical reads. Compare operator, estimates, actual row counts and any available runtime warnings. Record SQL Server version and compatibility level.
- Open the same approved plan in another tool and verify the properties. Compare read counts and runtime instead of assigning a winner from relative operator cost.
Conclusion
Keep the tool that lets you read the operator properties you use and hand a reviewer the original plan. Compare actual rows and query results before deciding a rewrite is better. Keep logical reads and the test inputs alongside the plan so someone else can repeat the comparison.
Frequently asked questions
What is the difference between an estimated and an actual SQL Server execution plan?
An estimated plan is compiled without running the statement and carries estimates. To get an actual plan, run the statement using plan capture. The result can include observed row counts, resource information and runtime warnings.
Can I open a SQL Server execution plan without connecting to the database?
Yes. SSMS and SolarWinds Plan Explorer can open a saved .sqlplan. Keep the XML when you need operator properties and statements for offline review.
How do I compare two SQL Server execution plans?
Capture both plans with the same schema, inputs and engine settings. Find the changed operators and compare estimated rows, actual rows and logical reads. Confirm both queries return equivalent results.
Which free tools can view SQL Server execution plans?
SSMS and SolarWinds Plan Explorer can open saved plans. The Microsoft MSSQL extension for VS Code includes a plan visualizer. Paste The Plan is an online sharing workflow for a plan you can publish.
What information can a SQL Server execution plan expose?
Plan XML can include statement text, compiled or runtime parameters, object names and database context. Review the source XML before sharing it outside your team or uploading it to a web tool.
Can I choose a faster SQL Server query from plan cost percentages?
Check that both queries return the same result, then compare observed logical reads, CPU, elapsed time and row counts under representative conditions. The plan cost percentages reflect optimizer estimates for the plan.