

A SQL Server deadlock involves a cycle of sessions waiting for each other’s resources. The engine chooses a victim and rolls back its work. A count or alert tells the team that a deadlock happened. The graph is what shows the victim, the other participants and the lock resources that formed the cycle.
Extended Events supplies the underlying deadlock report. SSMS can open the graph, and sp_BlitzLock makes the retained events easier to query. Commercial monitors can alert, group similar incidents or keep a copy longer than the engine’s local files. The useful comparison is whether the tool preserves enough evidence to tell a recurring application pattern from a one-off incident.
SQL Server deadlock analysis tools at a glance
Start with the evidence that survives the incident. Check whether an alert links directly to a graph and whether a DBA can export the original event.
| Tool | Starting point | Evidence to recover | Trial question |
|---|---|---|---|
| SQL Server Extended Events and SSMS | system_health xml_deadlock_report | Event XML or SSMS graph from retained file | Are the timestamp and original graph still available? |
| First Responder Kit sp_BlitzLock | Existing Extended Events graph data | Summaries and detailed rows for analysis | Can filters find both lab sessions and the victim? |
| Redgate Monitor | SQL Server deadlock alert | Deadlock graph and incident context | Can a DBA open the cycle from the notification? |
| SolarWinds SQL Sentry | SQL Server Deadlocks view | Graph, deadlock statements and export workflow | Does the evidence reopen outside the active incident? |
| SolarWinds Database Performance Analyzer | SQL Server blocking and deadlock view | Deadlock participants and wait context | Which graph details and export fields survive retention? |
| IDERA SQL Diagnostic Manager | Deadlock event and alert workflow | Deadlock details and history | Which edition and collection settings retain raw evidence? |
| Quest Foglight for SQL Server | SQL Server cartridge deadlock view | Deadlock details and historical incident context | Which fields are retained for the monitored platform? |
| SQLGrease | Deadlock collection and graph view | Cycle details and available query hashes | Can a participant be linked to its query history? |
| Netdata | Microsoft SQL Server deadlock metric | Time series and incident window | Can the count and UTC window lead to a separate graph? |
SQL Server Extended Events and SSMS
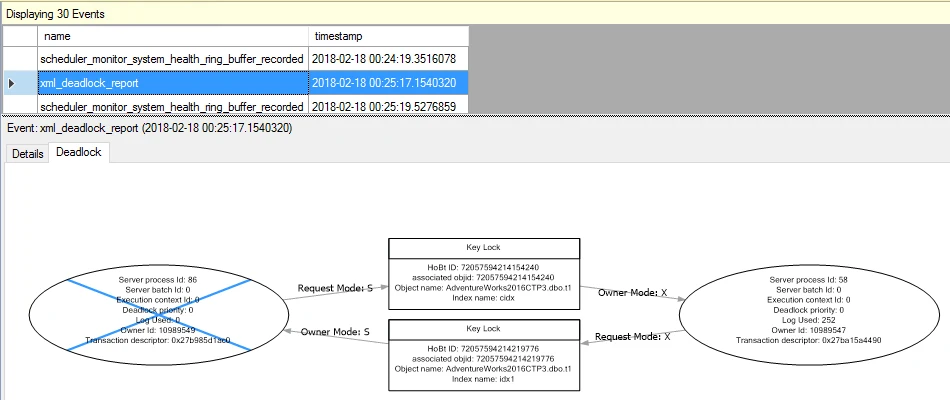
SQL Server Extended Events can capture xml_deadlock_report events, including them in the default system_health session on supported SQL Server and Azure SQL Managed Instance deployments. SSMS can open a saved deadlock graph and display the processes, victim and resources. This is a useful baseline for a DBA investigating a recent incident.
Native capture preserves the engine’s detailed account of the cycle. The ring buffer and file target retain limited history, so older events may have rotated away. Azure SQL Database uses a user-created Extended Events workflow, and a team that needs longer retention can persist relevant events separately.
On an authorized lab instance, open the system_health event file in SSMS. Filter for xml_deadlock_report and match its UTC timestamp to the 1205 error. Retain a copy of the graph before the file rolls over.
Check victim, process list and resource list together. The current request and its owners show how the two sessions formed a cycle. A dedicated event session can improve retention if the shared session's history is too short.
- Compatibility
- Supported SQL Server Extended Events and SSMS. Available targets depend on the SQL platform.
- License and trial
- Built-in database engine tooling and free SSMS client.
First Responder Kit sp_BlitzLock
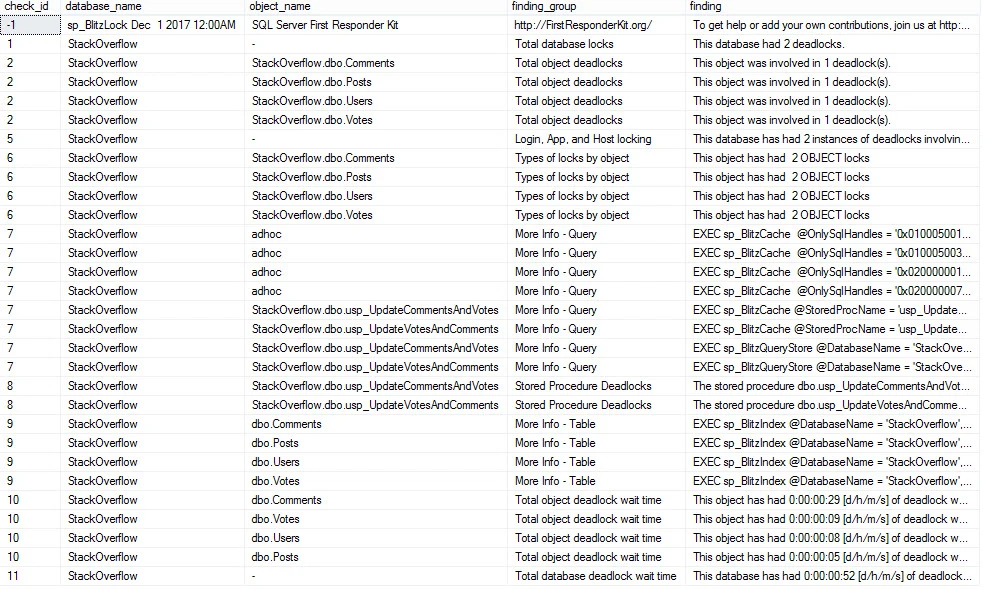
The First Responder Kit’s sp_BlitzLock reads available deadlock XML from Extended Events and summarizes relevant participants, queries and objects. It is useful when a DBA prefers T-SQL output or needs to filter and compare several retained events without opening each graph by hand.
Its advantage is making existing deadlock evidence easier to query. It can only analyze reports still present in the specified sources and visible to the account. A quiet result can reflect a short retention window, so the incident time and configured event targets matter.
Confirm sp_BlitzLock can read the selected Extended Events history with the lab role. Record its version, the time range and whether the SQL Server identity and database in the parsed rows match the original graph.
Use parsed rows to locate repeats by application, database or query, then open the original graph for the ownership cycle. Save both forms if evidence needs to survive event-file rotation.
- Compatibility
- Supported SQL Server and First Responder Kit version with access to relevant Extended Events data.
- License and trial
- Free, open-source diagnostic procedure.
Redgate Monitor
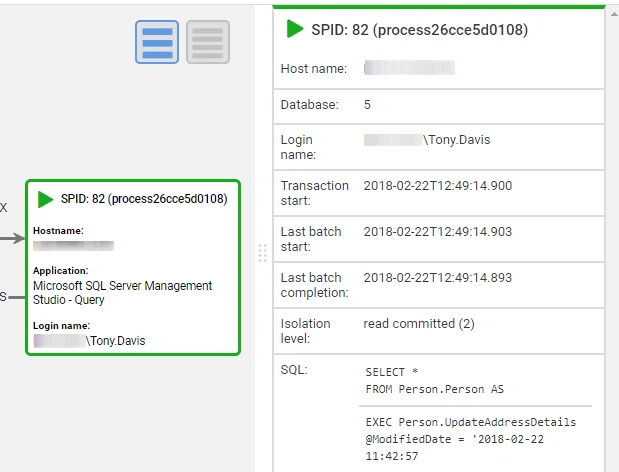
Redgate Monitor can surface deadlock alerts with a graphical depiction of the deadlock and available XML details. This is useful for DBAs who want to move from an alert to the victim and competing statements within the same monitoring workflow.
Its benefit is connecting the deadlock with the monitored instance and nearby activity. Collection and retention depend on the data source and Monitor configuration. Alert history is particularly useful when enough detail remains to identify the resource owners and underlying query pattern.
Open the test deadlock from a notification or the monitored instance timeline. Check whether the selected database, lock owners, waiting statements and victim line up with the native event.
Find the incident after both sessions finish and compare the original alert delay with the graph timestamp. Test which graph and query text are visible to the duty engineer's assigned role.
- Compatibility
- Redgate Monitor with deadlock collection enabled for a supported SQL Server deployment.
- License and trial
- Commercial monitoring license.
SolarWinds SQL Sentry
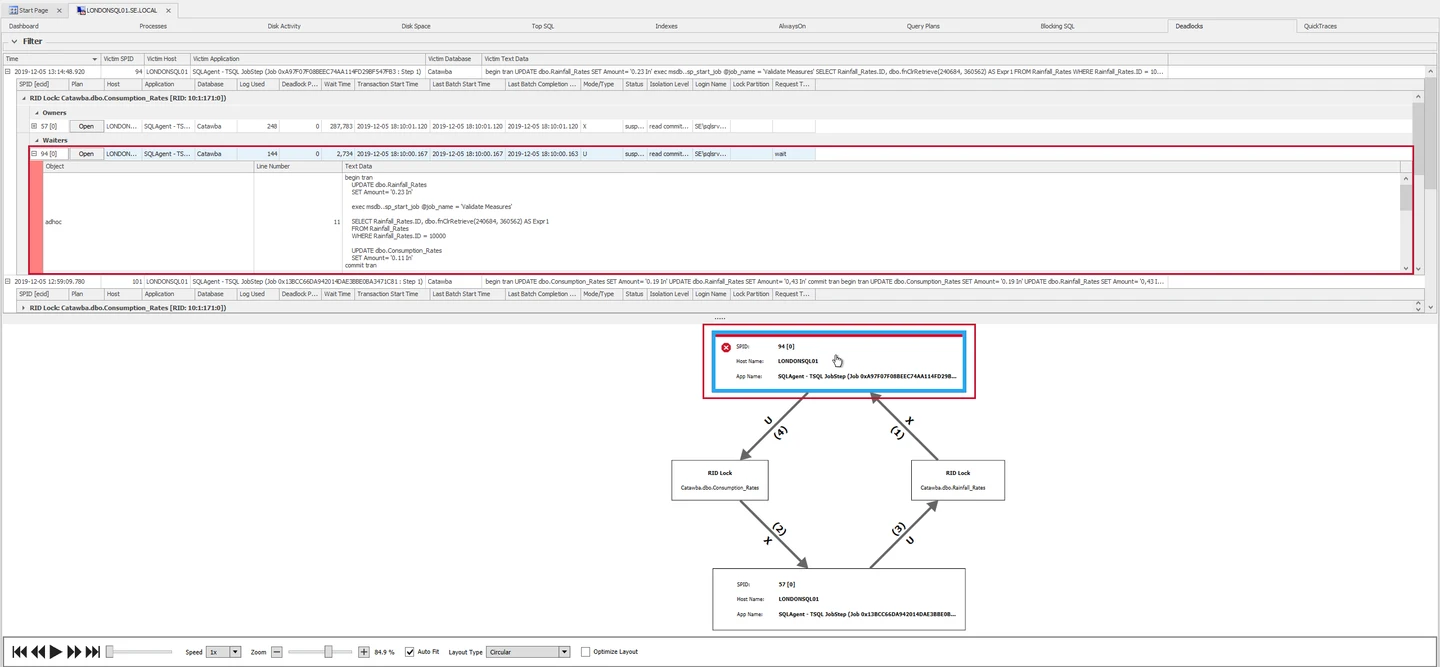
SolarWinds SQL Sentry exposes deadlock events and graph details in its performance analysis workflow, including the documented portal view. It is useful when a DBA needs to see a deadlock beside Top SQL, blocking and other monitored activity around the same time.
The value is preserving context that can explain why a recurring pattern became visible. Collection, product version and view affect the retained details. The graph identifies the cycle, while query history and the application’s transaction behavior help explain how to prevent it.
Find the deadlock in Performance Analysis and reopen the graph with statements and locks from the retained incident. Compare each participant with the native event before relying on the consolidated view.
If your escalation workflow requires sharing, test the documented export path with the on-call role. Store the graph and time window so an engineer can diagnose it without access to the originating event session.
- Compatibility
- SQL Sentry with applicable SQL Server deadlock collection and client or portal support.
- License and trial
- Commercial SQL Sentry licensing.
SolarWinds Database Performance Analyzer
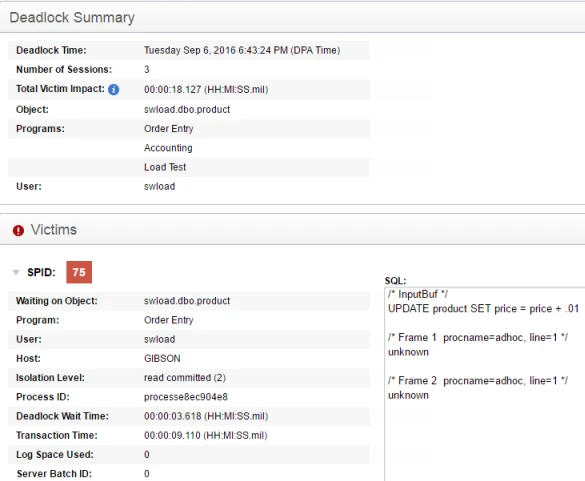
SolarWinds Database Performance Analyzer can show blocking sessions and deadlocks beside query wait data. Its deadlock analysis is useful when a DBA wants to distinguish a cycle that ends in a rollback from sessions that spent a long time waiting on another transaction.
Its strength is putting locking events in a wait-based investigation. The product’s supported targets and capture methods determine what event detail is available. The operator can combine DPA’s workload evidence with a native graph if a particular incident needs more transaction or lock detail.
Start from the DPA deadlock occurrence and inspect the participating SQL statements. Cross-check the graph or detailed view against the original XML and the session IDs supplied by the lab.
Use DPA's surrounding wait history to see what happened before the deadlock. Verify the connection, supported version and configuration determine which graph details are available in the current installation.
- Compatibility
- DPA with supported SQL Server monitoring and the relevant capture permissions.
- License and trial
- Commercial SolarWinds DPA license.
IDERA SQL Diagnostic Manager
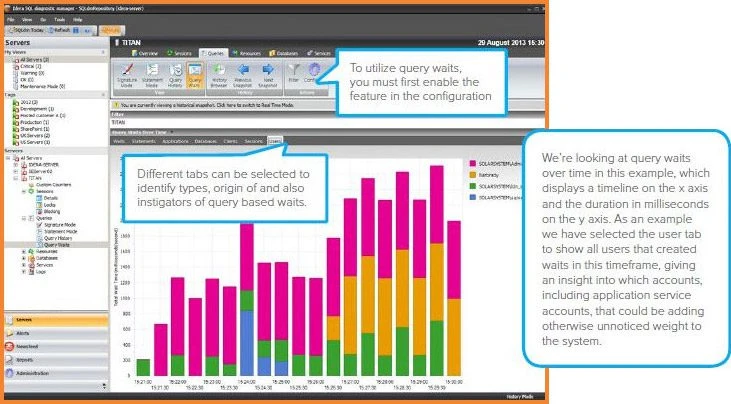
IDERA SQL Diagnostic Manager provides SQL Server deadlock monitoring and a way to inspect reported deadlocks in its console. This is useful for teams that already use the product’s alert workflow and need a way to follow an affected database or session from that starting point.
Its practical fit is handling alerts and collecting evidence across instances. The configured monitoring and alert setup determine what is captured and how long the evidence remains. A useful review checks whether the participant and resource details survive long enough to confirm a repeat problem.
Review the alert threshold, diagnostic data collection and history limits in the deployed version. Capture the trial's graph details at the same time you capture the IDERA incident identifier.
Verify whether the exported evidence preserves both sessions, the victim and resource identifiers. Keep the native event file as an independent source if the tool's export only supplies a summary.
- Compatibility
- SQL Diagnostic Manager with supported SQL Server access and appropriate deadlock monitoring settings.
- License and trial
- Commercial IDERA product.
Quest Foglight for SQL Server
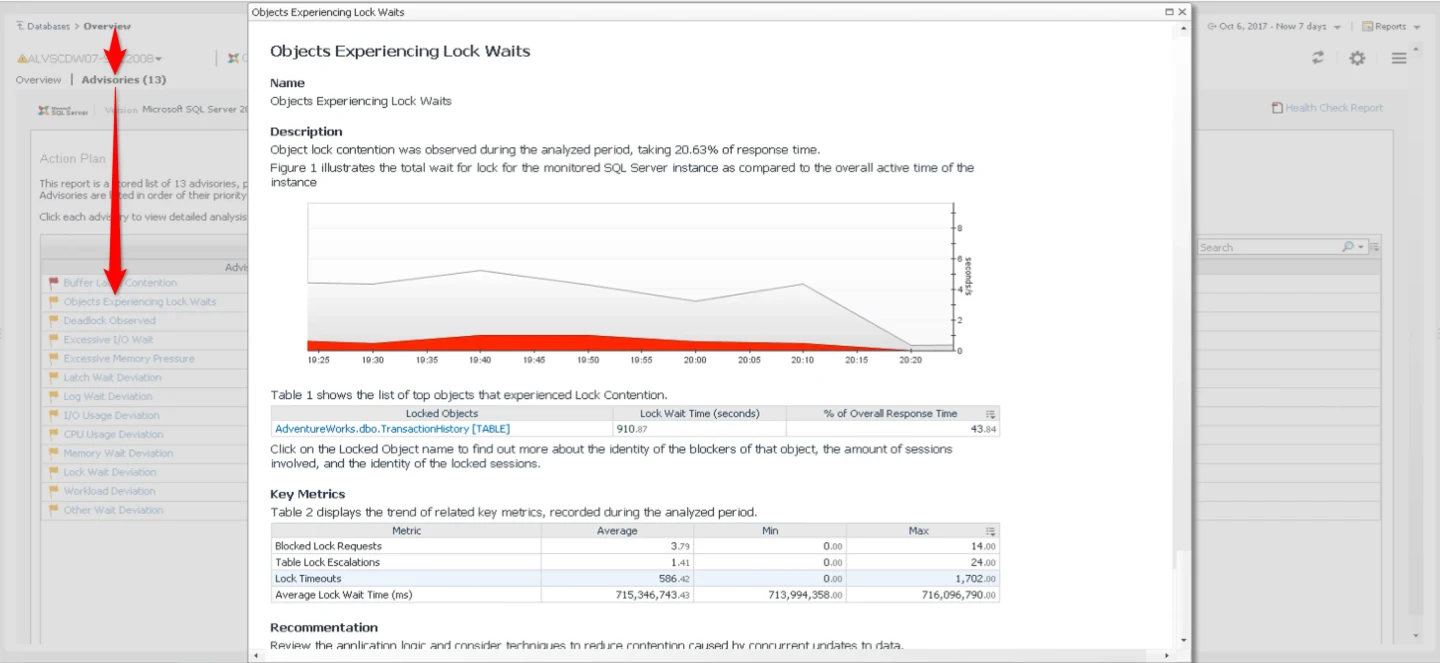
Quest Foglight for SQL Server provides workflows for investigating blocking and deadlocks. A DBA can review blocking evidence and affected SQL Server activity in the wider monitoring environment. This is useful when the incident involves several statements or needs to be correlated with other load.
The benefit is investigating the event alongside the SQL Performance Investigator and instance views where supported. Cartridge configuration and collection access determine the available detail. The team still needs a way to preserve the victim and resource evidence if it arrives after the source retention period.
Confirm that the SQL Server cartridge is collecting deadlock events on the target. Open the resulting incident and match both participants and the victim to the native graph before sharing it.
During the trial, check the navigation from a monitored database to the history and record the configured retention. Give the on-call role enough access to reconstruct the cycle after the live activity disappears.
- Compatibility
- Supported Foglight SQL Server cartridge, monitored connection and appropriate diagnostic collection.
- License and trial
- Commercial Quest license and any applicable SQL PI features.
SQLGrease
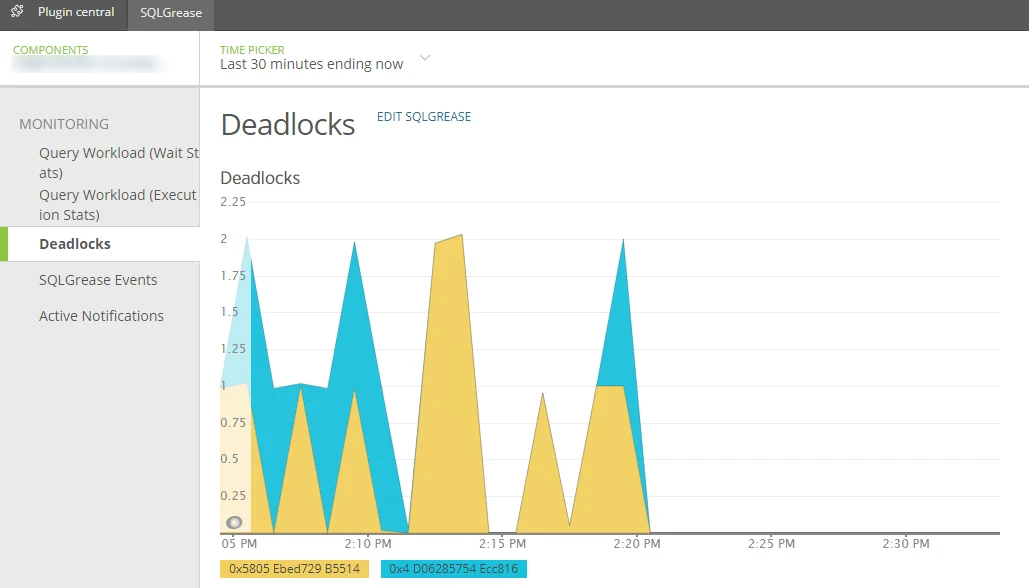
SQLGrease captures SQL Server deadlocks and can group similar events. The product can expose query hashes and retain a downloadable graph for supported captures. This is useful when a DBA needs to identify a recurring pattern among several alerts that look similar at first.
Grouping and query identifiers make repeated incidents easier to compare. The retained graph and collected query history depend on the monitoring connection and the available event data. Resource and process details still need review to establish whether several events share the same root cause.
The documented graph can expose query hashes when available. Match one displayed hash with nearby query history and record what extra context is available for the statements involved.
Use the timestamps, lock resources and participation list to validate each test graph, including any entries without a usable hash. Verify what evidence can be exported and how runner credentials limit collection.
- Compatibility
- SQLGrease with supported SQL Server deadlock collection enabled.
- License and trial
- Commercial monitoring plan.
Netdata
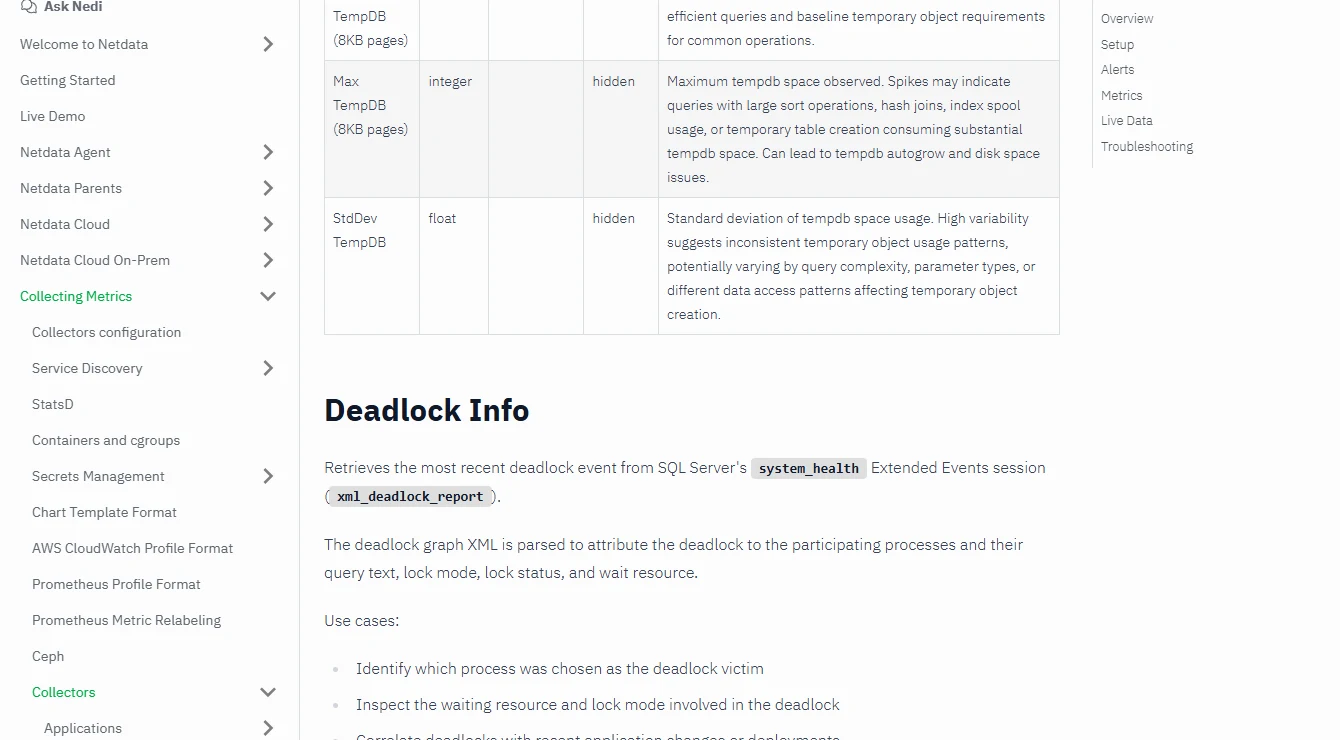
Netdata’s MSSQL collector can chart deadlock activity and offers an on-demand deadlock-info function for the most recent retained report. The parsed result includes details such as the victim, query and wait resource. It is useful when an operator wants quick context directly from a metrics dashboard.
The function depends on the available Extended Events source and permissions. It surfaces the latest accessible report, which is useful for immediate triage. A longer incident record still needs a retention or export workflow that keeps evidence for earlier deadlocks.
Use the deadlock chart to locate the UTC window. If the sampling interval is coarse, select a wider range and keep the native graph or another diagnostic source ready for the same instance.
Check the alert time against the Extended Events timestamp, including metric scrape delay. Pair the alert runbook with a clear way to find the victim and both resources in the retained graph.
- Compatibility
- Netdata MSSQL collector with access to SQL Server and the configured Extended Events target.
- License and trial
- Open-source collector and applicable commercial Netdata plans.
Choose a tool by how you investigate deadlocks
| What you need | Tools to shortlist | What to verify |
|---|---|---|
| Read an existing XML graph or inspect captured events | Check where the event was stored and whether the time window is still retained. | |
| Alert on deadlocks and inspect the participating sessions | Run one lab deadlock and verify which victim, statement and lock details are linked from the notification. | |
| Connect deadlocks to waits, query history or host charts | Confirm the exact collection feature, the retained detail and what the next shift can open. |
Decide which deadlock evidence your team needs
Deadlock analysis starts with a cycle. Each participant waits for a resource held by another participant. SQL Server breaks the cycle by selecting a victim and returning error 1205 to it. In this lab, the second connection uses a lower deadlock priority so you can identify the expected victim in advance.
On standard SQL Server, the default system_health Extended Events session captures xml_deadlock_report. After a repeatable event, compare the tool's count, alert, graph and export with that capture. Each step has a different retention requirement.
A time window for an occasional deadlock
Use the native graph and a counter or alert
Keep a fast way to reopen the correct instance's event file.
An incident page that traces both statements and the victim
Trial a graph-first SQL Server monitor
Require the participants, resources and lock modes under the on-call role.
A repeatable investigation across an estate
Check historical search and export
Verify available filters, collection coverage and retained graph data.
Inspect the victim, both processes and the resource cycle
Use the session IDs returned at the start of both workers to find your graph among other events. In the graph or its XML, follow the victim list to the process entry, then match each requested lock with its owner on the other resource. The exact resource identifiers can depend on the instance's locking and engine settings.
Record the incident timestamp and the tool's notification and capture times. Save the XDL or equivalent native event in the lab for later reinspection, especially when testing shorter retention. Share graphs according to your SQL text handling policy.
| Evidence | Expected in the trial | Capture question |
|---|---|---|
| Victim and error | Worker B receives 1205 under low priority | Does the alert show the chosen victim? |
| Participants | Two captured session IDs with statement context | Can both batches be located after rollback? |
| Resource cycle | Each session requests an item protected by the other | Are wait and owner roles and modes both visible? |
| After the incident | Trial table values return to their original state | Can responders still reopen or export the graph? |
How to compare these tools
Reproduce a two-session deadlock on a test instance. Compare graph retention, the victim, statements and resources, and confirm whether the alert still includes the graph after the sessions end. Sources checked .
Match a known deadlock to its SQL Server graph
Create an empty disposable DeadlockTrial database. Run the script once with @Step set to Setup, then in two separate autocommit connections with @Step set to A and B. Start B a few seconds after A prints that it holds its first row. Both test transactions are rolled back by the engine or script.
Generate a two-session deadlock in a disposable database
T-SQL · 48 lines
- Open the native system_health event file before you start so the comparison shares a baseline. Run Setup once in the empty database, then start worker A and worker B within the 12-second overlap.
- Record both session IDs and confirm the expected 1205 from B. If both workers completed without it, check the overlap and retry with fresh connections. When finished, check that both stored Marker values are zero.
- Open the captured graph in SSMS and the shortlisted tool. Verify both participants, lock ownership, victim and export. Reopen it after the alert has cleared and record the configured retention.
Conclusion
Pick the tool that gives your DBA the graph while it is still useful. Require a working route from the alert to the event, an identifiable victim and set of resources, and enough history for the next shift to investigate. Start with Extended Events and add a collector when you need fleet alerts or longer retention.
Frequently asked questions
How can I see a deadlock graph for SQL Server error 1205?
Open the available xml_deadlock_report event in SSMS Extended Events or in a monitor that captures it. On SQL Server, the default system_health session collects these events. Match the time and instance against the client error.
Is a blocked-session graph the same as a deadlock graph?
A blocking chain shows sessions waiting for a resource. A deadlock requires a cycle of dependencies, and SQL Server chooses a victim to break that cycle. Inspect the specific deadlock event when you need that history.
Why does the ring buffer return no deadlock rows?
It is a bounded snapshot. The event may have aged out, the session may be stopped, or its XML output may be truncated. Check the event file, session state and time window.
Does Azure SQL Database have the SQL Server system_health session?
Azure SQL Database uses database-scoped Extended Events for this workflow. Configure a session with database_xml_deadlock_report and check that your tool can read it with the intended permissions.
Does a deadlock graph show which query should be fixed?
The graph identifies the victim and waiting resources. Investigate transaction order, lock duration and query access paths on both sides. The query chosen as victim can be only one part of the cause.
What if both worker scripts finish without error 1205?
They may have run without overlapping long enough to form a cycle. Use fresh connections, start B a few seconds after the first-row message from A, and retest in the disposable database.
How can I verify a tool's deadlock graph independently?
Open the corresponding xml_deadlock_report in the instance's system_health event file. Match timestamp, victim and both process IDs, then trace each resource owner to its waiter.