

Checkmk and Zabbix both fit teams that monitor hosts, services and databases from one platform. Checkmk can discover SQL Server services through its agent plug-in. Zabbix organizes collection and alerting around templates, such as its MSSQL options for ODBC or an agent plug-in. Both benefit from an existing inventory and a consistent way to install and manage collectors.
A general monitor is useful for service health, SQL Server counters and estate-wide alerts. A database-specific monitor usually provides more direct paths into query history, plans and blocking. The difference matters when the same team is expected to handle the alert and identify the SQL statement behind it. The collector location, database permissions and coverage of Windows and Linux also affect the choice.
Checkmk vs Zabbix and six alternatives at a glance
Use the collection path to estimate rollout and credential ownership. In the trial, compare a stale SQL Server backup, a server with no matching history and a collector that cannot connect.
| Tool | Collection path | Where the alert is configured | Evidence to reopen |
|---|---|---|---|
| Checkmk | mk-sql agent plug-in on a Windows or Linux host | Discovered services and service rules | Plug-in output, service state and notification |
| Zabbix | Agent 2 or ODBC template, depending on deployment | Template items, triggers and macros | Item timestamps, trigger expression and resolution |
| Paessler PRTG | SQL v2 sensor from a probe | Result channel limits and notifications | Probe result, channel state and execution time |
| ManageEngine Applications Manager | MSSQL monitor from a collection server | Per-monitor metric thresholds and actions | Monitor snapshot, poll history and health event |
| Icinga for Windows | PowerShell check executed by Windows agent | Service definitions and notification rules | Plugin output, check result and event history |
| New Relic Microsoft SQL Monitoring | Microsoft SQL integration on Infrastructure agent | NRQL alert condition for ingested data | Entity, sample timestamp and loss-of-signal state |
| Redgate Monitor | Base Monitor connects to SQL Server | SQL Server aware rules and alert configuration | Instance, database, alert record and collection status |
| Datadog Database Monitoring | Datadog Agent SQL Server integration | Monitor query, data scope and no-data settings | Tag-scoped timeseries and Agent status |
Checkmk
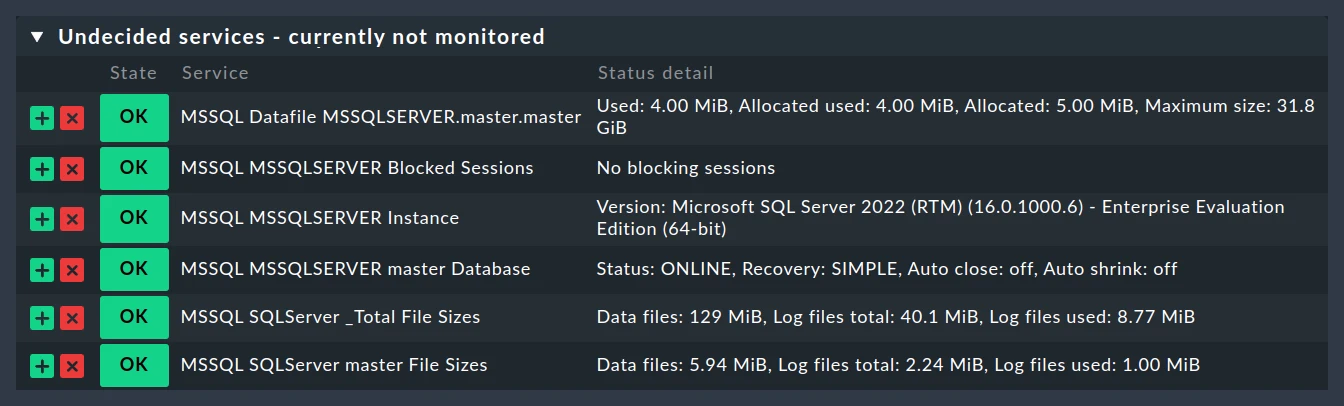
Checkmk’s MSSQL monitoring uses the Checkmk agent and the mk-sql plug-in to discover and collect configured SQL Server services. It is useful when the team wants SQL Server status and database checks next to the Windows or Linux hosts it already monitors in Checkmk.
The strength is reusing agent, discovery and alert workflows across an estate. SQL Server connectivity still requires an appropriately configured agent and account. Commercial Agent Bakery can distribute configuration, while a manual deployment gives the operator responsibility for keeping it consistent.
Install mk-sql on a dedicated lab collector and run service discovery. Keep the relevant agent output and verify that the service is attached to the right instance and database when two instances share a host.
Run the lab through a fresh backup, a threshold breach and a collector failure. Record the service check details and notification rule so the operations team knows whether to inspect SQL Server backup history or agent credentials.
- Compatibility
- Checkmk and the applicable mk-sql agent plug-in. Connectivity and remote monitoring depend on the version and host.
- License and trial
- Community and commercial editions. Agent Bakery is a commercial feature.
Zabbix
Zabbix offers SQL Server monitoring templates, including ODBC and supported agent-based approaches. It can discover database objects and collect counters and trigger states. This is useful for an operations team that wants one set of host, database and availability rules governed from Zabbix.
The templates give a reusable starting point, with collection and credentials configured per environment. Drivers, agent versions and database permissions determine which checks work. A counter or trigger can identify symptoms, and deeper investigation may still require SQL Server query evidence.
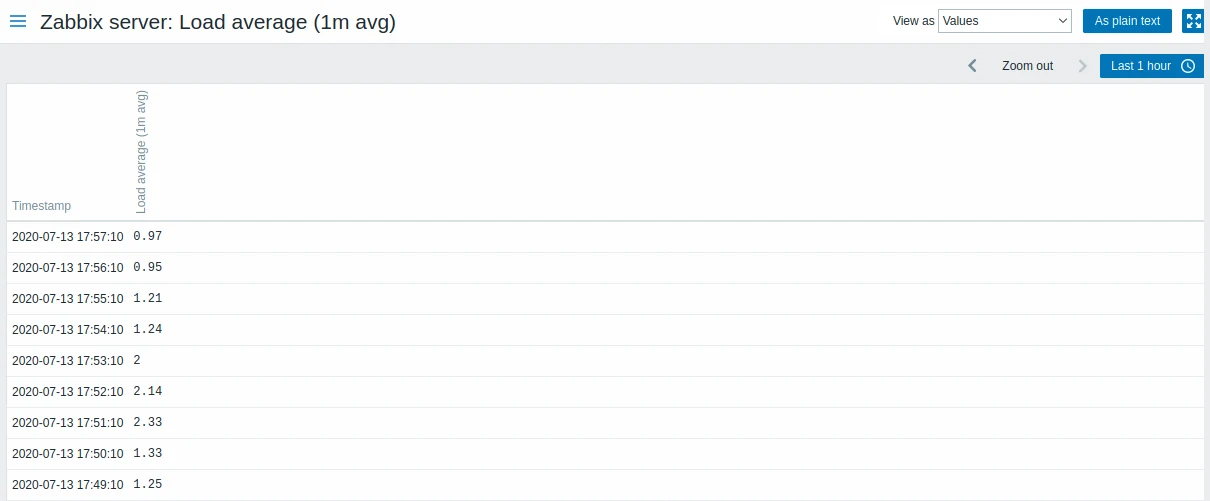
Choose the exact Zabbix version and one MSSQL template before comparing defaults. The Agent 2 and ODBC variants have different collection paths. Keep a deployment record of driver, template version and which server, proxy or agent makes the connection.
Open Latest data and verify the database discovery rows and macro resolution before sending alerts. Capture the backup-age item timestamp alongside the database trigger, then confirm that stale or unsupported telemetry also produces an actionable signal.
- Compatibility
- Zabbix server or proxy with the supported ODBC or Agent 2 template and SQL Server access.
- License and trial
- Open-source Zabbix. Commercial support and services are optional.
Paessler PRTG
Paessler PRTG includes Microsoft SQL and general network and host sensors. A SQL sensor can run a query, while separate sensors check other parts of the path. That is useful when a small team wants selected database conditions treated as monitored services in the same interface.
It fits explicit checks that can be scoped to the instance or database of interest. The probe location and authentication decide which path each sensor tests. Sensor counts and configuration grow with the estate, and monitoring predefined signals leaves deeper query analysis to the operator.
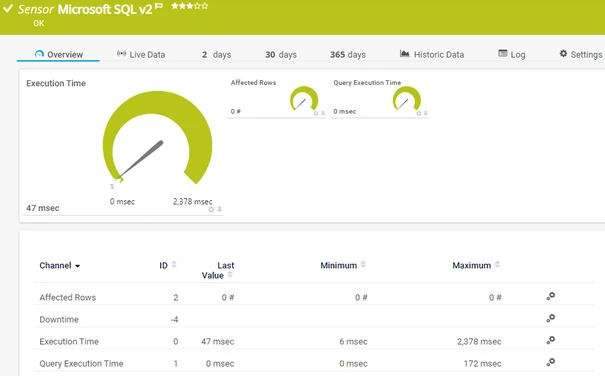
Use one Microsoft SQL v2 sensor and a small query that returns the metric your policy requires. Confirm which probe runs the query and save the numeric channel and elapsed time as separate observations where configured.
Check how the sensor and notification behave when the database returns an empty result, an old backup date or a connection failure. Keep the probe's identity and channel configuration with the incident.
- Compatibility
- Supported PRTG probes and relevant SQL Server or host sensors.
- License and trial
- Commercial plans and free or evaluation terms vary by deployment.
ManageEngine Applications Manager
ManageEngine Applications Manager monitors SQL Server as part of a broader application and infrastructure monitoring service. Its SQL Server monitor can present database and instance health alongside other components of the application. This is useful for teams that own several technology layers.
Its main strength is combining SQL Server with application and host monitoring in a common alert workflow. The selected monitor and permissions determine the detail available to a DBA. Which hosts, SQL instances and Azure resources are monitored also affects licensing and operational coverage.
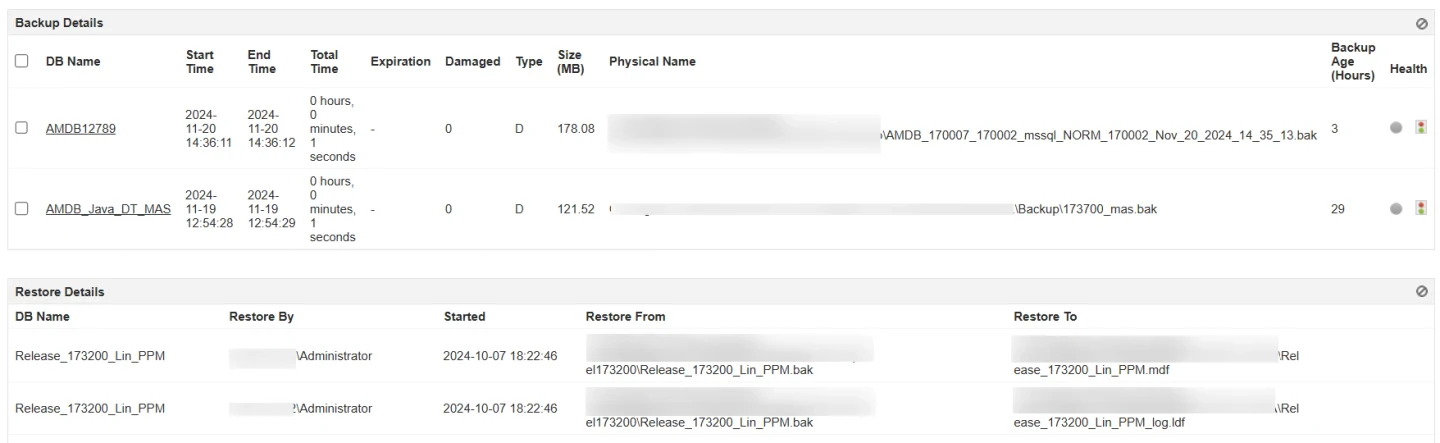
Start with an MSSQL monitor on the correct collection server. Open its database detail and save the metric history for one database whose backup policy you know before applying thresholds to an entire group.
Where a built-in metric differs from local policy, test the exact available query or metric configuration in your edition. Record the last poll and the monitor's event response before using the alert as recovery evidence.
- Compatibility
- Applications Manager with supported SQL Server connectivity and permissions.
- License and trial
- Commercial plans with feature and monitor limits.
Icinga for Windows
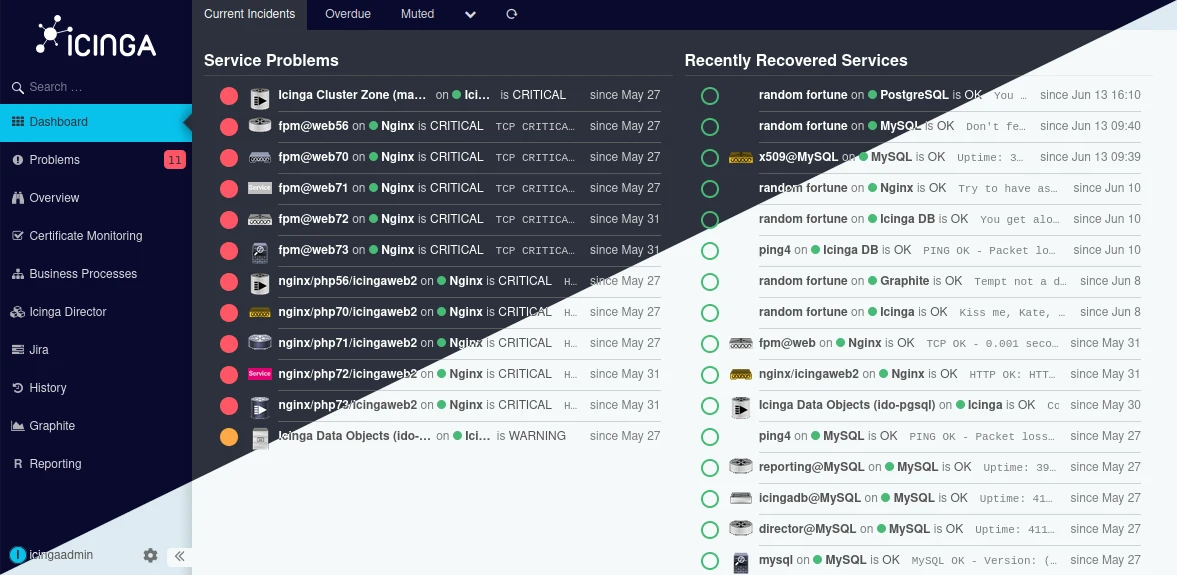
Icinga for Windows has PowerShell MSSQL plug-ins for running defined checks against SQL Server and returning results to the monitoring server. This is useful for teams that already manage Windows components with Icinga and want SQL Server checks deployed through the same framework.
It works best when the team can maintain its check definitions and agent rollout. Installation and execution take place under a Windows context, and the credentials used by the plug-in determine the database data it can report. The checks are designed around monitored conditions and need other evidence for query troubleshooting.
Check which Windows agent executes the MSSQL PowerShell checks, then identify which services apply to each instance. Keep live plugin output in the trial so you can distinguish a SQL error from a threshold result.
Verify how the selected command represents unknown or inaccessible data. Confirm what notification route receives the event, and capture the state change after the lab identity is restored.
- Compatibility
- Icinga for Windows, PowerShell MSSQL plug-ins and appropriate SQL Server access.
- License and trial
- Open-source components, with optional commercial support.
New Relic Microsoft SQL Monitoring
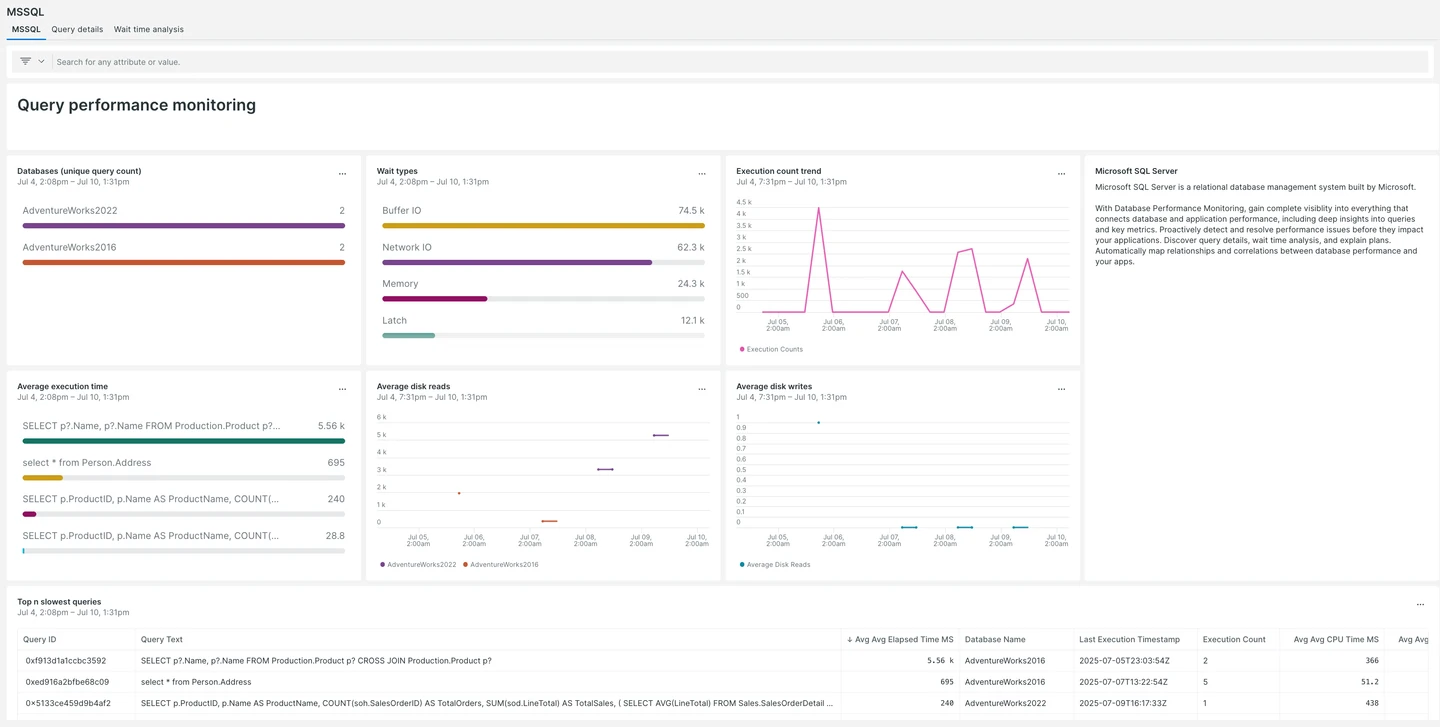
New Relic’s Microsoft SQL Server integration collects instance and database metrics into its observability platform. It fits teams that already investigate application requests and infrastructure through New Relic and want database metrics in the same account.
The benefit is linking a database signal to the affected service and host. Which details are available depends on the integration configuration and supported metrics. Query-level diagnostics need separate collection where supported, so the team should judge the integration against the incidents it handles.
Inspect data from one known Microsoft SQL integration instance before writing the NRQL condition. Verify the entity, database labels and which metric or event represents the check you are trying to operationalize.
Evaluate the alert aggregation window with its separate loss-of-signal behavior. In the lab, stop only the test integration long enough to determine how a stale observation appears in the incident timeline.
- Compatibility
- Supported New Relic infrastructure integration with configured SQL Server access.
- License and trial
- Commercial New Relic usage and retention terms apply.
Redgate Monitor
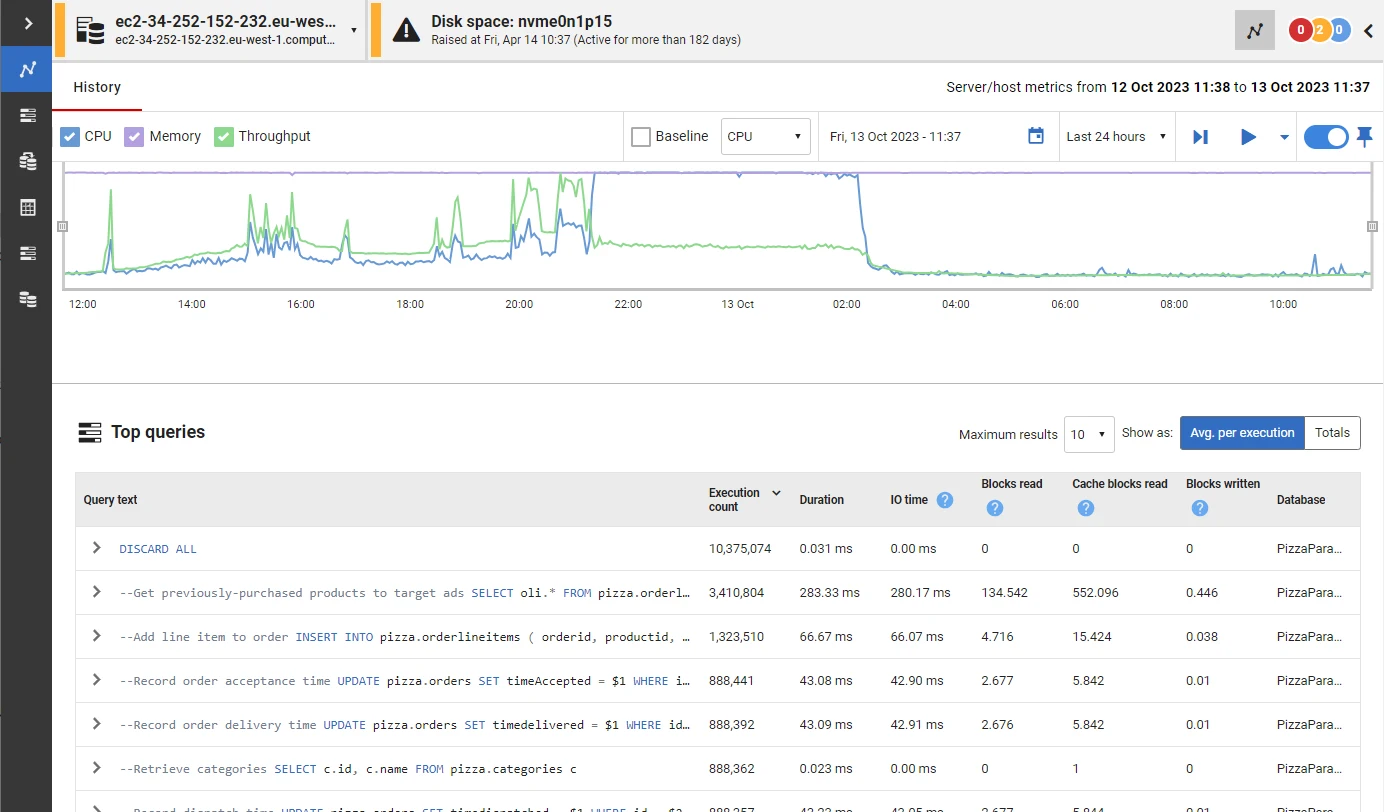
Redgate Monitor provides a database-centered view of SQL Server instances, queries, alerts and estate health. It is useful when the operator needs to work directly from a database alert to query, wait or blocking evidence. The workflow is designed for SQL Server and other documented database engines.
Its benefit is specialized SQL investigation alongside ordinary database alerting. The feature matrix varies for Windows, Linux and managed SQL Server. If the team also needs checks across switches and unrelated services, those can remain in the infrastructure monitoring platform.
Start from the instance alert view and compare both the alert threshold and the collected data for the test database. Match backup history against the local policy before relying on an instance-wide default.
Use the Base Monitor and instance health to check how the SQL credential failure appears. Verify what incident details remain after the database is healthy so the DBA can reconstruct the original threshold breach.
- Compatibility
- Redgate Monitor with supported SQL Server connections and appropriate database or host permissions.
- License and trial
- Commercial monitoring license.
Datadog Database Monitoring
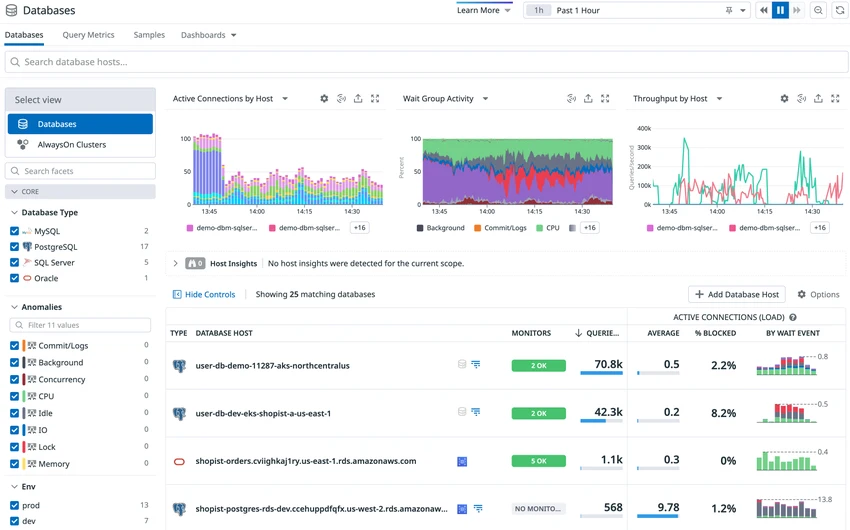
Datadog Database Monitoring can show normalized SQL Server queries, samples and performance metrics alongside its application and infrastructure monitoring tools. It is useful when the team wants SQL Server troubleshooting inside a wider observability service and has an Agent that can reach the database.
The advantage is linking query activity to application symptoms and infrastructure events. Agent, integration and database credentials each affect coverage. Sampling determines what appears during short incidents, and Database Monitoring is a distinct entitlement from basic host or SQL integration metrics.
Check which Agent emits each SQL Server and database tag. Scope the test monitor to one stable tag set and inspect last-collected data before setting a no-data or freshness expectation.
Where the backup rule needs an explicit collection query, use an approved custom metric and confirm the SQL grant, cardinality impact and plan. Keep the source query and alert threshold with the test evidence.
- Compatibility
- Datadog Agent with SQL Server Database Monitoring enabled for supported targets.
- License and trial
- Commercial Database Monitoring and applicable infrastructure plans.
Checkmk vs Zabbix side by side
| Feature | Checkmk | Zabbix |
|---|---|---|
| Collect SQL data | Use the Checkmk agent with mk-sql. Configure local SQL access or set up a remote collector with TCP access. | Link the MSSQL Agent 2 or ODBC template. Install the MSSQL plug-in on the Agent 2 collector or the ODBC driver on the Zabbix server or proxy. |
| Discover and identify a database | Run service discovery, then confirm the instance and database on each discovered service. Check remote data mapping if one collector covers several targets. | Review low-level discovery, the host macros and Latest data. Check that the item identifies the intended instance and database. |
| Set a backup-age threshold | The backup-per-type check lists Windows as the supported agent. Confirm backup type and configure warning and critical levels on the lab service. | Set the full, differential or log thresholds in the template macros. Use per-database context and verify the type is enabled. |
| Page on a failed SQL Agent job | Set the job-state rule explicitly. The documented job check ignores job status by default. | Check job discovery, the latest job status item and the trigger and action used to notify operators. |
| Handle stale SQL records | Test the agent and the SQL plug-in independently. Review the stale-service interval and the notification path. | Check latest item timestamps, missing-data triggers, dependencies and recovery. Test a failed ODBC or Agent 2 path while the host still responds. |
| Estimate operating cost | Checkmk Community is open source. Commercial infrastructure monitoring is priced by monitored services. Count the services discovered for a representative SQL host. | Zabbix is open source. Estimate collection, database and proxy resources, retention and optional commercial support. |
Choose a shortlist for the checks you need
| What you need | Tools to shortlist | What to verify |
|---|---|---|
| Discover SQL jobs, database checks and backups alongside the host | Run discovery on one real topology and verify target names, defaults and alert delivery. | |
| Run known SQL checks through an existing infrastructure platform | Test from the intended probe, set SQL grants and record the check timeout and expected result. | |
| Investigate the database after an infrastructure alert | Verify your chosen query or wait detail stays available until the next shift and relates to the alert’s database. |
Choose the collector location before comparing screens
Checkmk's SQL plug-in has documented Windows and Linux installation paths and feeds discovered services. Zabbix provides different MSSQL template paths through Agent 2 and ODBC. Choose a supported version, then draw the path from SQL Server to the alert engine and assign ownership of every credential.
A remote collector is useful when teams cannot install a host agent. It also adds a probe-to-database connection worth monitoring. An existing Windows or Linux agent changes rollout cost, so include the actual packaging, secrets rotation and support work in the comparison.
The Checkmk agent is already managed on the SQL hosts
Trial mk-sql and discovered services
Verify each instance and service after rolling out the plug-in configuration.
A Zabbix proxy can reach the database endpoints
Compare ODBC and Agent 2 placement
Record which host needs the driver, template and credential.
An application monitoring stack already owns alert routing
Trial that integration on one database
Compare the resulting SQL evidence and no-data behavior with both dedicated alternatives.
Use one backup policy and test four alert states
This sample checks for the last completed regular full backup recorded by the current instance. Use 24 hours as the lab cutoff. The SQL check reports local server timestamps because backup history uses local timestamps. If backups run on replica instances, decide how to aggregate their histories for the real policy.
Backups in msdb are evidence of recorded operations. A restore exercise is the check for usable backup media and recovery objectives. Set collection failure and missing data handling explicitly so both tools route an actionable issue when they stop polling.
| State | What to observe | Expected handling |
|---|---|---|
| Fresh record | Eligible full backup within the example threshold | Show an up-to-date sample and the run timestamp |
| Stale record | Eligible full backup older than the threshold | Raise a backup-age alert naming the database and threshold |
| Missing history | No eligible regular full backup entry on this instance | Raise or route a separate missing-history condition |
| Collection failed | Timed out, blocked network path or credential failure | Show a collector failure or no-data state after the configured grace period |
How to compare these tools
Monitor the same Windows host and SQL Server instance. Check job failures, backup age and collection permissions, then compare the alert text and the maintenance work to keep checks running. Sources checked .
Give both monitors the same database and backup history
Run this read-only check on an existing disposable database named MonitorTrial using the same principal as the test collector. In the lab, vary the cutoff to test fresh and stale cases. Use a second fresh disposable database with no eligible history if you also need to test the missing case and change the name in the guard for that connection.
Check regular full backup freshness from local msdb history
T-SQL · 26 lines
- Record the Checkmk plug-in and Zabbix template versions, identities and poll intervals. Confirm independent SQL query results for the same endpoint and database.
- Compare the last backup timestamp and actual alert event in both tools. Check their treatment of copy-only rows before concluding the vendor's default is equivalent to this lab policy.
- Temporarily stop only the lab collector or change its lab access, then observe the separate collection signal. Restore access and verify the event transitions and retained audit timeline.
Conclusion
Choose the tool the on-call team can operate during a backup or job failure. Verify the monitor watches the right SQL instance, the alert arrives with the database name, and the team can detect stale SQL data. Add query history when the same team also needs to investigate a slow workload.
Frequently asked questions
Can Checkmk monitor SQL Server on Linux?
Yes. Checkmk documents mk-sql for Linux and Windows. Check the supported-agent entries for individual services, including the Windows listing on the backup-per-type check.
Does Zabbix require Agent 2 to monitor SQL Server?
Zabbix provides two template paths. The Agent 2 path uses the MSSQL plug-in. The ODBC path uses a Microsoft ODBC driver and a configured data source on the Zabbix server or proxy.
Does a SQL Agent job automatically alert when it fails in Checkmk?
The documented MSSQL Jobs check ignores job state by default. Configure a job-state rule and confirm the delivered notification with a deliberately failed job in your lab.
What is the difference between an old SQL backup and stale monitoring data?
Backup age measures how long ago the last matching backup completed. Data freshness measures when the collector last read that information. Verify both so operators know whether to investigate the backup job or the collection path.
Can these tools show why one SQL query is slow?
Start with their blocked-session checks, counters or templates. Compare query samples, waits and retained plans in a SQL-focused product if your incident process needs statement-level history.
Can an old SQL backup and a broken collector trigger the same alert?
Configure separate backup-age and collection-health handling. An old timestamp is a database observation. A broken collector means the alert engine cannot obtain a new observation.
Will a local msdb query find a backup made on a different replica?
The script queries the connected SQL Server instance's local history. Aggregate relevant replica histories or use an authoritative backup catalog when the policy permits backups on multiple replicas.