

SQL Server on Linux exposes many of the same database views as SQL Server on Windows. The host has different monitoring interfaces. A SQL connection can show waits, sessions or database activity. A Linux collector or an SSH connection can show filesystem, memory and host process conditions. The most useful Linux setup tells an operator which source produced each signal.
Some SQL Server monitors can collect both views. Others are stronger at query performance and need a separate host agent. Grafana Alloy, Telegraf, Netdata and Zabbix let teams assemble the two paths from collectors. The choice depends on the evidence needed during an incident and whether the team wants a packaged investigation view or is prepared to maintain its own dashboards.
SQL Server monitoring tools for Linux at a glance
The first comparison is how the SQL collector reaches the instance. The second is whether you can match a SQL file to the Linux storage underneath it during the same interval.
| Tool | SQL collection path | Linux evidence to verify | Trial concern |
|---|---|---|---|
| Redgate Monitor | Base Monitor to SQL instance | SSH host metrics and mount labels | Check both credentials independently |
| SolarWinds Database Performance Analyzer | Central database monitoring connection | Separate Linux device and guest metrics | Correlate central SQL wait history and host UTC range |
| Quest Foglight for SQL Server | SQL Server cartridge and agent | Host agent support for exact distribution | Check cartridge, Foglight version and host-agent coverage |
| Datadog Database Monitoring | Agent SQL Server integration and DBM | Linux Agent host and disk integration | Match DB host aliases and cloud/agent tags |
| Grafana Alloy and Grafana | MSSQL exporter through Alloy | Linux node exporter metrics | Align discovery labels and scrape timestamps |
| Telegraf and InfluxDB | Telegraf SQL Server input | Disk I/O and system inputs | Verify tags, query selection and backend retention |
| Netdata | MSSQL integration and host Agent | Linux disk latency and queue charts | Match SQL target metadata to actual chart host |
| Zabbix | MSSQL template via Agent 2 or ODBC | Linux Agent or Agent 2 template | Distinguish SQL endpoint from Linux host identity |
Redgate Monitor
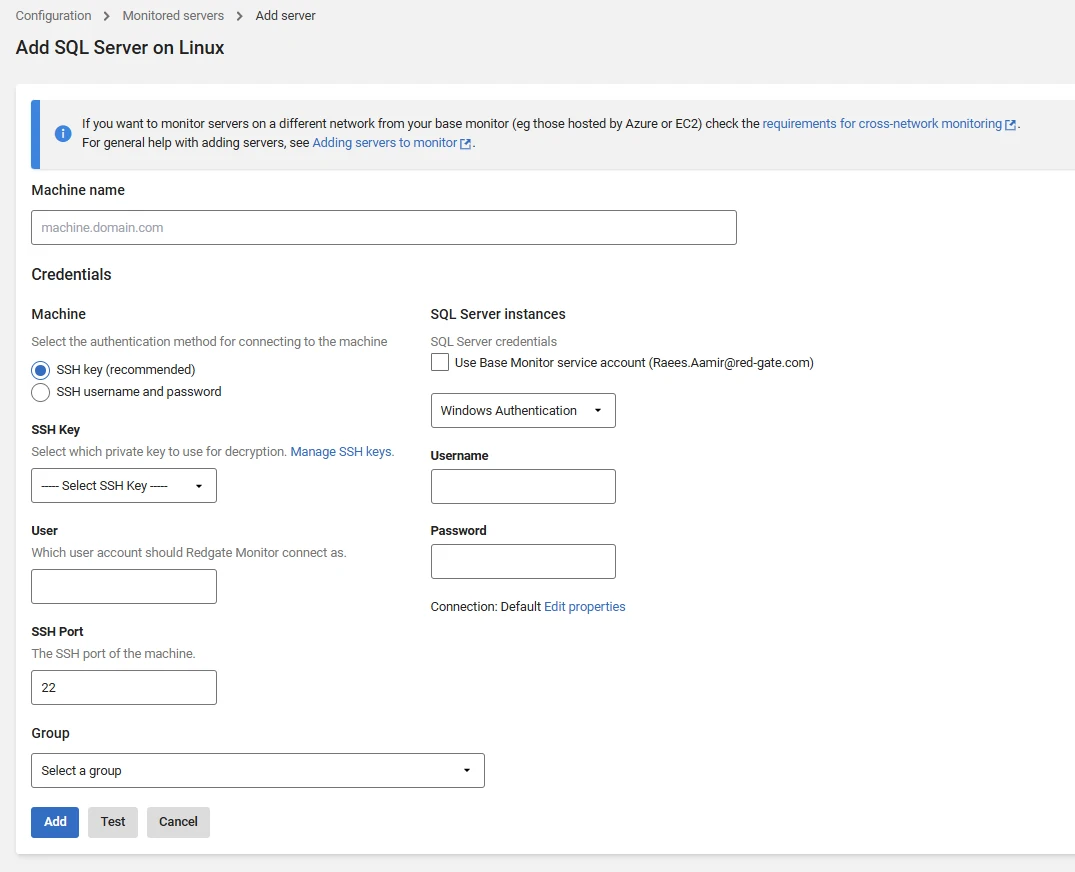
Redgate Monitor has a documented SQL Server on Linux workflow. It connects to the engine with SQL credentials and can collect machine data over SSH. This is useful when a DBA wants to examine a change in SQL activity beside Linux filesystem or host resource information from the same time.
The benefit is connecting the instance and host views without giving SSH root access. The Base Monitor platform still matters in a mixed estate. Redgate documents that a Linux Base Monitor needs a separate Windows Base Monitor for Windows targets, so the monitoring topology can change when both platforms are used.
Use a dedicated SQL login for the engine observations and verify the SSH identity used by the Linux host connection separately. Capture the exact timestamp, host and database for a file delay so you can reopen that evidence after the incident.
Inspect the SSH and SQL collection health independently. Simulate one missing permission in the lab and verify that the console shows the affected collection path while preserving the useful data from the other path.
- Compatibility
- Supported SQL Server on Linux host and Redgate deployment, with applicable SQL and SSH credentials.
- License and trial
- Commercial Redgate monitoring license.
SolarWinds Database Performance Analyzer
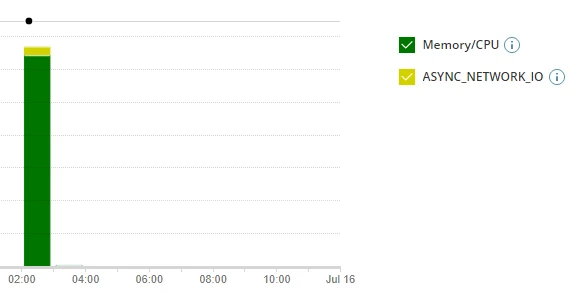
SolarWinds DPA collects SQL Server workload and wait evidence through a database connection. On supported SQL Server on Linux targets, it is useful for finding which statements and waits dominate an incident. The monitoring view works around database activity and can include multiple database platforms.
It fits teams that want query performance available without building their own dashboard. A database connection and Linux host collection expose different evidence. The supported DPA version, target permissions and companion host monitoring determine how far an operator can go when an issue begins at the OS level.
Start with the query and wait history from the DPA polling service. Keep the Linux storage chart open at the same UTC interval and compare the database file's device path before interpreting what the wait grouping suggests.
Confirm the exact SQL Server release, edition and Linux platform in the current support information for your DPA release. A successful remote login proves SQL connectivity. Check the host-disk collector and chart coverage for your deployment in a separate trial step.
- Compatibility
- DPA with a supported SQL Server on Linux deployment and database monitoring permissions.
- License and trial
- Commercial DPA licensing.
Quest Foglight for SQL Server
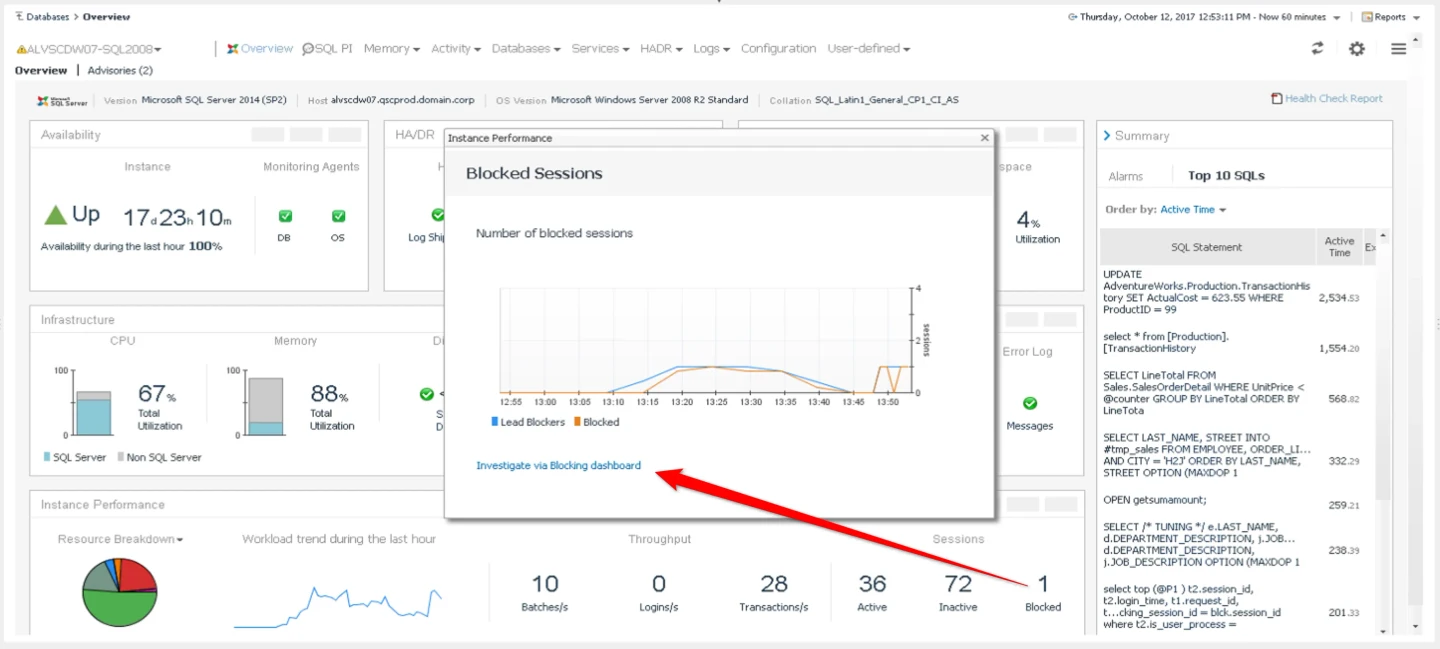
Quest Foglight can monitor supported SQL Server deployments with its SQL Server cartridge. That gives DBAs a view into engine activity and available query investigation even when the database runs on Linux. It is useful when SQL Server lives in a larger estate managed through Foglight.
Its main value is keeping the database investigation workflow consistent across supported platforms. Linux host metrics and database evidence may follow separate agent paths. The SQL Server version, Foglight cartridge and permissions determine the diagnostics the service can collect.
Record the SQL Server cartridge and management server versions with the supported monitored platform. Run the SQL collection and Infrastructure agent checks separately so the hardware data still has a clear owner during an escalation.
When an instance is remote or discovered by alias, verify the host record to which Foglight attributes the SQL metrics. Compare a single file interval with the Linux storage observer and inspect gaps in the chart as well as changes in latency.
- Compatibility
- Supported Foglight and SQL Server on Linux configuration. Host monitoring can require separate setup.
- License and trial
- Commercial Quest monitoring product.
Datadog Database Monitoring
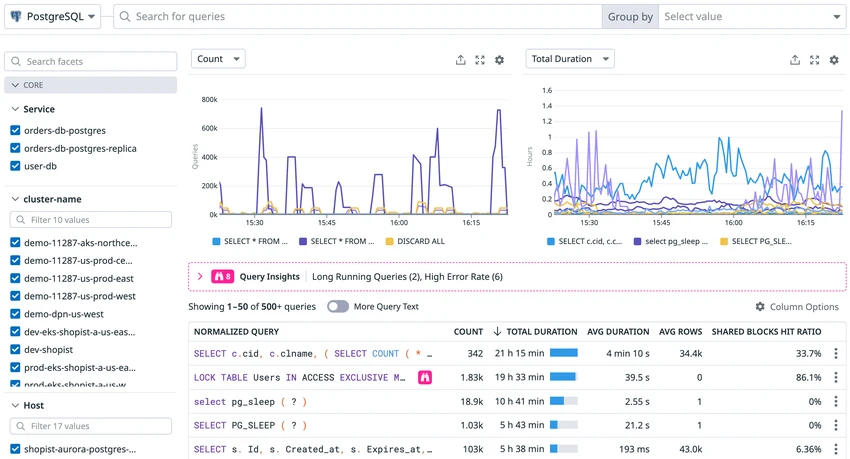
Datadog Database Monitoring can collect SQL Server metrics, normalized queries and samples through its Agent. The Linux host can also provide system metrics through the installed Agent or a supported host integration. This is useful when a database investigation needs to sit beside application and infrastructure telemetry.
Its strength is combining signals in one service when the team has the same host and database identifiers. Supported SQL Server features depend on connection and collector configuration. The Agent, applicable database permissions and chosen host integrations all contribute to what an incident view can show.
Check which Agent connects to the Linux SQL Server endpoint. Collect guest or storage metrics from the service host and tag the database instance and host so you can find both without using a hostname that changes across deployments.
Link a known query sample, a SQL file metric if collected and the guest device at minute resolution. Measure how quickly each stream appears, then estimate monitoring scope and retention from the actual plan and series you enabled.
- Compatibility
- Datadog Agent with supported SQL Server connectivity and optional Linux host integration.
- License and trial
- Commercial Database Monitoring and infrastructure monitoring terms apply.
Grafana Alloy and Grafana
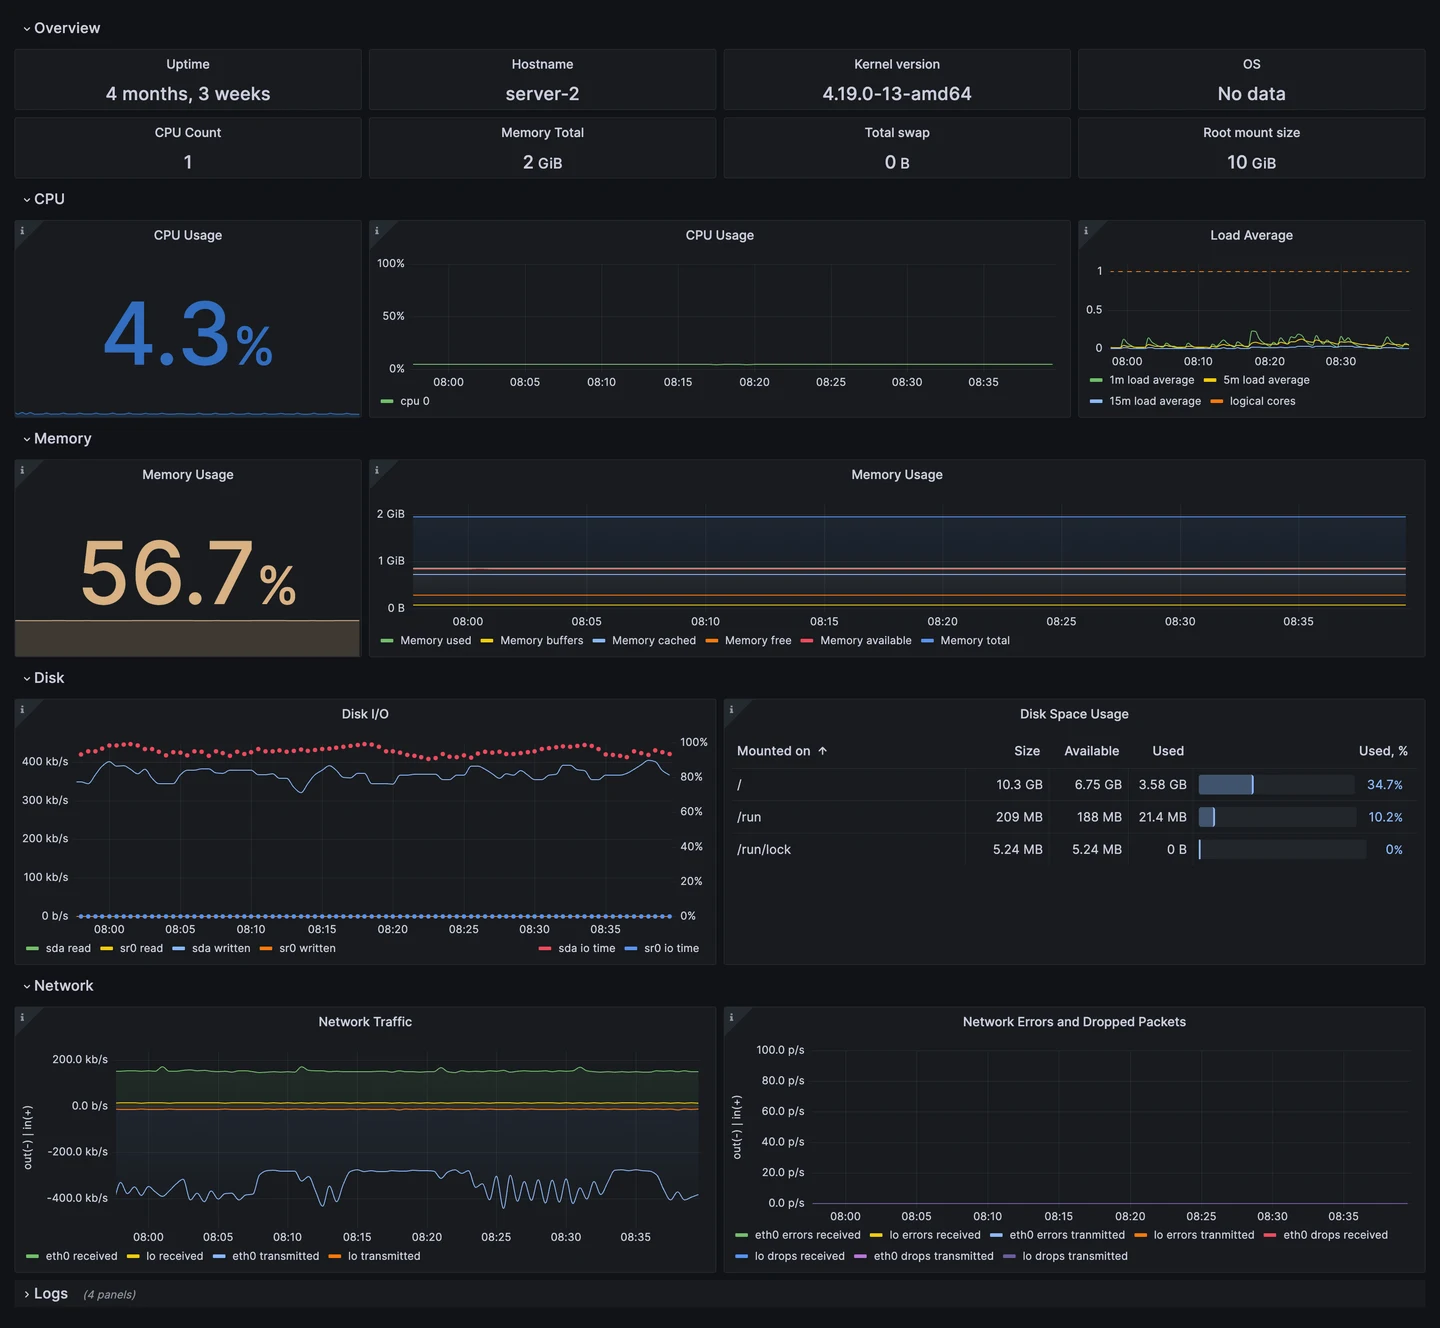
Grafana Alloy provides an MSSQL exporter and a separate Unix exporter component for Linux host metrics. A team can send both sets of measurements to a Prometheus-compatible destination and graph them together. This is useful when the existing monitoring stack is based on Grafana and metrics.
Its strength is controlling collection and dashboards directly. The engine exporter and host exporter have different configurations and permissions. The team owns metric selection, label alignment and the incident views that make those numbers useful for SQL Server.
Use the Alloy MSSQL exporter for the database measurements and a Linux system exporter for the node view. Keep one stable instance label and a separate host label so a database move shows up in the inventory.
Record the SQL scrape interval, the node scrape interval and the range function applied in PromQL. Verify that a counter reset or a scrape outage produces visible missing evidence in the dashboard and alert rule.
- Compatibility
- Grafana Alloy with supported MSSQL and Unix exporter configurations and a compatible backend.
- License and trial
- Open-source components and optional managed backend licensing.
Telegraf and InfluxDB
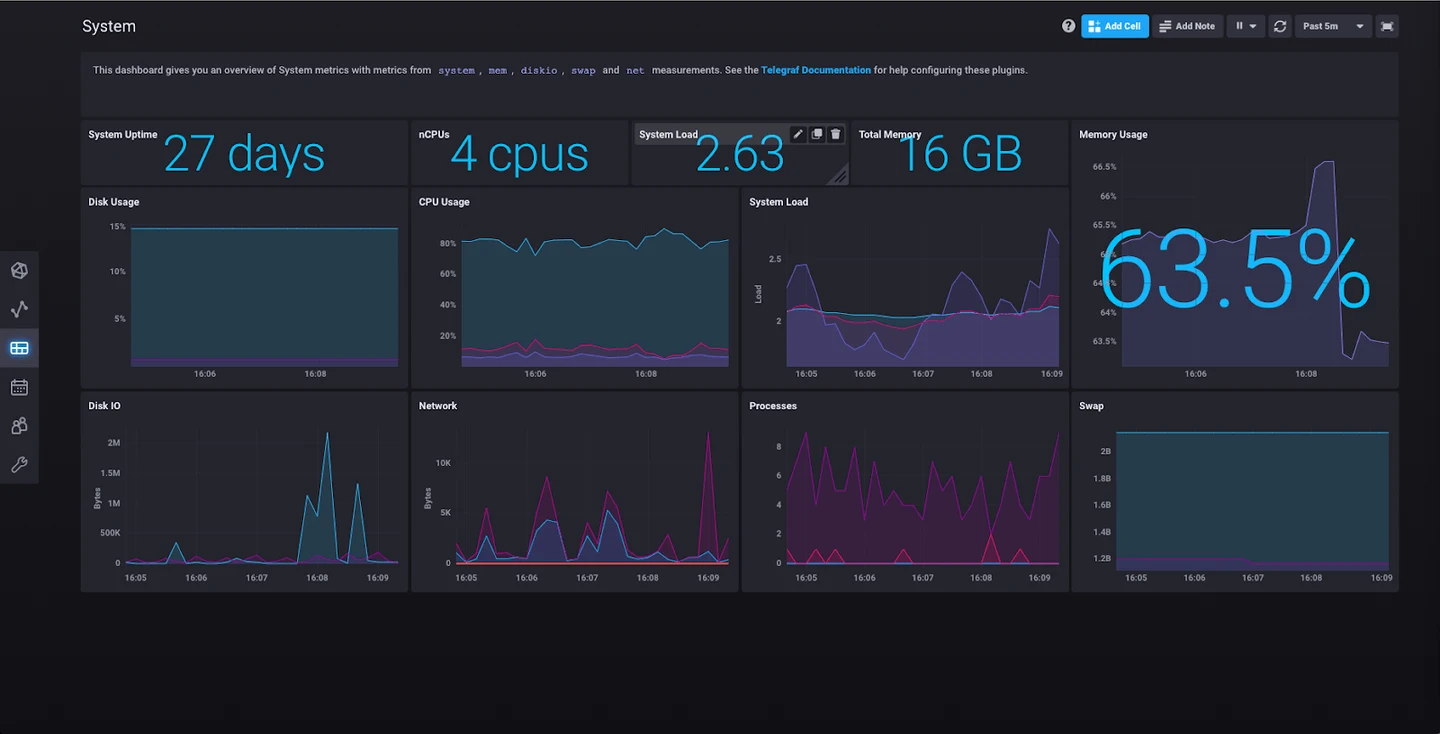
Telegraf’s SQL Server input collects SQL Server metrics, and the same agent can collect Linux metrics through separate system inputs. The collected time series can go to InfluxDB or another configured output. This is practical for teams that already use Telegraf for host monitoring.
Its attraction is a collector policy the team can maintain as configuration. Query groups, credentials and SQL Server version determine database coverage. Dashboards and alerts require their own design, including stable labels linking each database instance to its Linux host.
Set the SQL Server input to a named target and the intended query collections. If the Agent also runs on the database host, sample Linux disk I/O through a host input and keep the physical device label alongside the SQL target tag.
Inspect the raw two timestamps before plotting a rate or derivative. Review output retention and index cardinality with the database and file tags in place, since the volume of series depends on which queries you actually enable.
- Compatibility
- Telegraf with SQL Server connectivity, suitable system inputs and a time-series destination.
- License and trial
- Open-source collector. InfluxDB hosting and managed services have separate terms.
Netdata
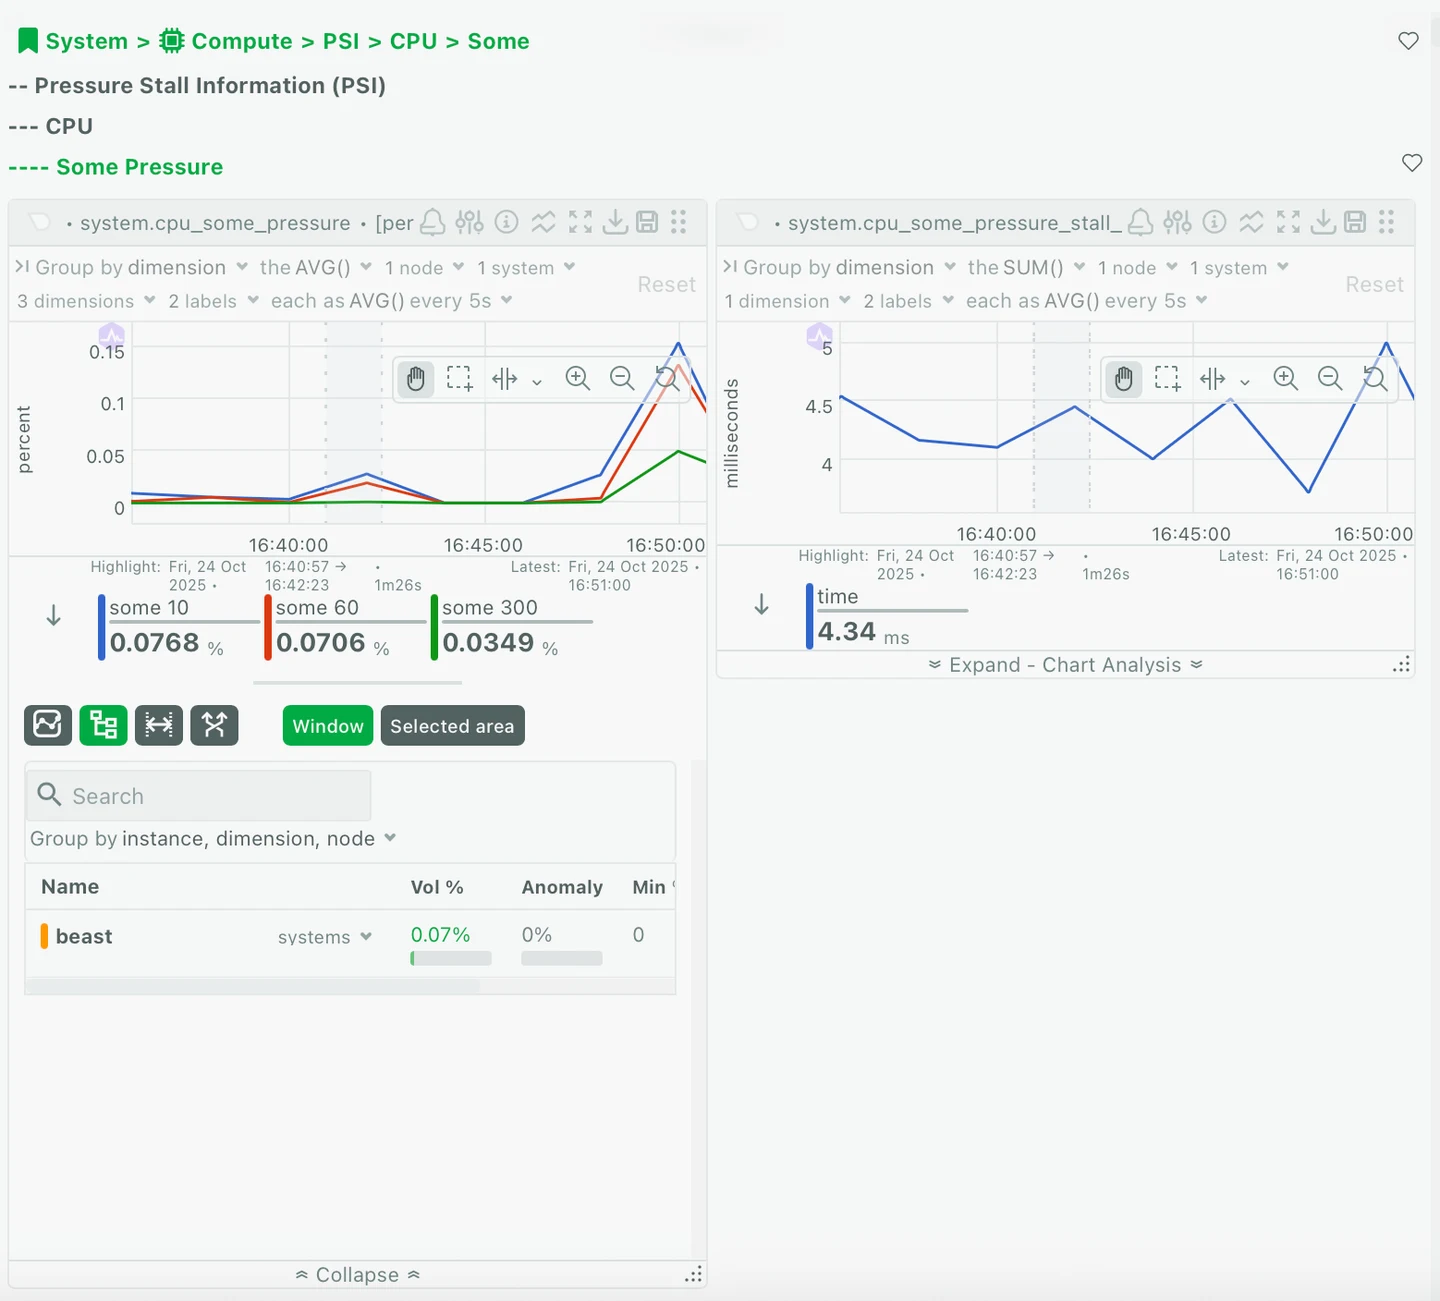
Netdata has an MSSQL collector that charts available SQL Server metrics and can run alongside the host’s Linux collection. This is useful when an operator wants to see database behavior beside CPU, memory or filesystem activity without assembling all of the host charts manually.
It fits a team that primarily wants metrics and alerting with a straightforward collector. The measurements available depend on the SQL Server and login, and longer retention or fleet views depend on the setup. Detailed query plans and lock investigations may need another tool.
Pair the MSSQL charts with the Agent on the Linux host that owns the database volume. Open a short time window and compare the SQL service file with the correct Linux block-device chart, especially when Netdata also monitors the container.
Validate the collector and chart identity by pausing the lab-only collector or removing only its test access. Check how a disconnected SQL chart appears beside continuing host metrics and what evidence remains after the connection is restored.
- Compatibility
- Netdata agent with its MSSQL collector and supported SQL Server connectivity.
- License and trial
- Open-source agent features and commercial Netdata plans.
Zabbix
Zabbix offers Microsoft SQL Server templates and separate Linux templates. An ODBC-based path or a supported agent plugin can collect engine data, while the Linux agent observes the host. It is useful when the team wants database and OS triggers to live within an established Zabbix deployment.
Its benefit is reusable monitoring rules for an estate. Template versions, driver support and account privileges affect what gets discovered. Metrics, triggers and query sampling answer different questions, so the team should account for how database incidents will be investigated beyond the alert.
Choose the SQL Server template and collection location before installing a Linux agent. An ODBC connection from a proxy can collect database values remotely, while Linux host discovery and device items still depend on how the host is monitored.
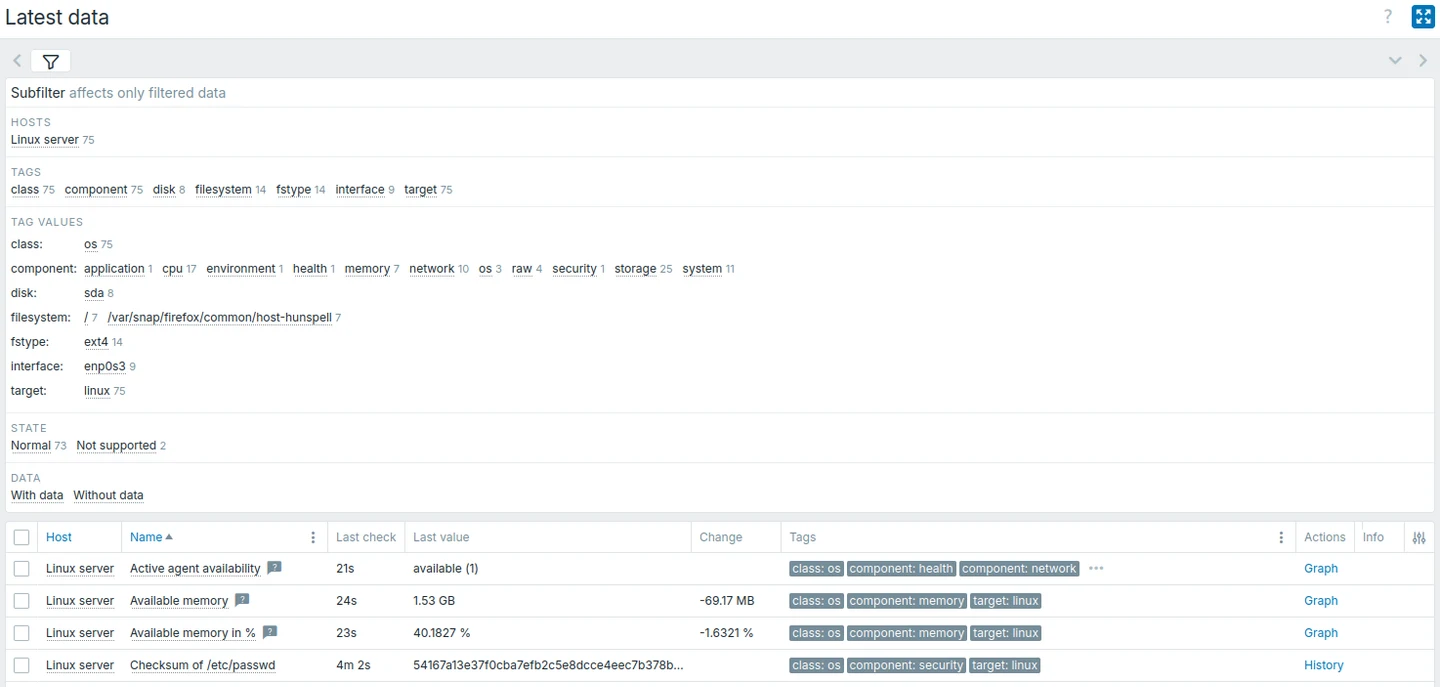
On the dedicated Zabbix test host, open latest data for one SQL item and one Linux device item. Record actual last-update timestamps and look at unsupported item and no-data behavior with the connection intentionally disabled in the lab.
- Compatibility
- Zabbix with compatible SQL Server and Linux templates, agents or proxy, and required drivers.
- License and trial
- Free, open-source platform with optional paid support and services.
Match the monitor to your SQL Server on Linux setup
| What you need | Tools to shortlist | What to verify |
|---|---|---|
| Investigate query waits and blocking on a Linux instance | Verify the exact SQL Server version, a known database incident and the depth of SQL history after it ends. | |
| Correlate SQL activity with Linux process or host data | Check the SQL endpoint and host tags refer to the same machine or workload. Confirm which metrics you retain. | |
| Add SQL Server to a monitored fleet with your own dashboards and alerts | Test separate host and SQL collection, alert routes and the maintenance work needed to keep them reliable. |
Choose where to collect SQL and Linux evidence
SQL wait time, SQL file stall time and block-device latency describe different scopes. The database tracks waits issued against its files. The Linux device includes I/O from any service using that device. In a container, resolve the database file within its mount namespace, then use deployment metadata to identify the backing host path or persistent volume.
Use UTC and record the collection windows. One coarse SQL poll can average away a short I/O spike that a faster host sample captures. Establish both time ranges before assigning a cause.
You can see SQL waits and query activity
Collect from the Linux storage layer
Map the file through its mount and match the device sample.
You can see a slow Linux device
Check SQL file counters
Identify which database files issued reads or writes during the window.
The Linux host hides the workload in a container
Resolve the mount in its namespace
Correlate the persistent volume or bind mount with guest or storage metrics.
Record a SQL file and Linux device during the same interval
Pick a lab instance, one data file and a 15-second interval. Record the database file path, device identifier, latest host samples and SQL counter deltas. For example, an increase from 300 to 500 reads and 900 to 2,100 milliseconds means 200 reads and 6 milliseconds of average SQL read stall in the interval. These values illustrate the calculation.
Run the host commands in the namespace where the database file is visible. Extend the capture if the host chart samples at a larger interval. Map device-mapper, multipath or network storage through the appropriate host or provider topology before selecting a chart.
| Layer | Record | Cross-check |
|---|---|---|
| SQL Server file | Instance, database, file ID and UTC sample start/end | Reads, stall delta and average milliseconds per read |
| Mount namespace | SQL path, filesystem and mount target | Persistent volume or host bind path when applicable |
| Linux block device | Device, UTC and one-second r_await and read rate | Include the device-mapper relationship if there is one |
| Application | Query or operation, errors and timestamp | CPU, blocking or network as other explanations |
db_file='/var/opt/mssql/data/LinuxIoTrial.mdf'
test -r "$db_file" || exit 1

findmnt --target "$db_file" --output SOURCE,TARGET,FSTYPE
lsblk --output NAME,TYPE,PKNAME,MOUNTPOINTS
TZ=UTC iostat -x -t -y 1 15How to compare these tools
Run a short block and a host resource spike separately. Check that the SQL monitor can collect from your Linux deployment and that host metrics and database events can be matched by time. Sources checked .
Compare SQL file latency with the correct Linux device
Run this connection in an existing disposable database named LinuxIoTrial. The script takes two read-only observations of its first data file. If you already have a representative lab read, run it on a second connection during the window. A fully cached read can leave the physical counters unchanged. Use the findings to compare coverage and interval alignment.
Sample read I/O on one Linux test database file
T-SQL · 33 lines
- Connect with the collection identity and confirm the permissions appropriate for the SQL Server release. Start the T-SQL and host sampling together, with UTC clocks checked on both systems.
- Record the returned file path, timestamps, read count and average read stall when present. For a zero-read interval expect zero reads and a null average. Repeat during representative work if the file experienced no physical reads.
- Match the file to the device or backing volume and compare with the reviewed tool's data. Capture the SQL and Linux series' actual timestamps, signal gaps and evidence availability after the test.
Conclusion
Pick the tool that lets your team retrieve the evidence it needs during an incident. A DBA monitor should show which SQL activity waited. A Linux collector should show the relevant host or container pressure. Verify that the incident timeline lines up and that the on-call team can still access it the next day.
Frequently asked questions
Can I use the same SQL Server monitor on Windows and Linux?
Some tools support both as monitored targets. Check the vendor’s version and feature list for Linux. Windows service checks and performance counters can require separate Linux host collection.
Can SQL Server on Linux report host metrics over a SQL connection?
SQL Server exposes engine metrics and some host information over SQL. SQL Server 2025 on Linux added host views for CPU, disk, network and virtual memory. Check the OS or container scope for each metric and use a host collector when you need data across versions or while the engine is down.
Why can SQL file latency rise while the Linux disk chart looks normal?
SQL reports waits against a particular database file. The Linux chart may average over more operations, show a different device or use a different time window. Match the file to its actual mount and device, then compare the same interval and statistic.
What changes if SQL Server runs in a Linux container?
Confirm the collector sees the container, its host and the correct SQL endpoint. The node may have CPU or memory available while the container is constrained by its own limits. Record which scope each dashboard and alert uses.
Can I use Query Store with Linux SQL Server monitoring?
Yes. Query Store is scoped to a database and can capture query plans and runtime history when configured for that workload. Use the same time window to correlate it with host telemetry.
Should SQL file latency match Linux iostat r_await?
Use both to correlate incidents by timestamp. SQL file latency covers a particular file and its reads. The device average covers all reads issued to that device by workloads that share it, with potentially different sampling windows.
How do I identify the device when SQL Server runs in a Linux container?
Resolve the file against the container's mount, then use container or orchestration metadata to identify a bind mount or persistent volume. Use the host, storage or provider metrics for the backing device.