

Monitoring SQL Server on Amazon RDS involves two sources. SQL Server can expose query and session information through a database connection, while AWS provides instance metrics, logs and service events. A monitor can query DMVs over the database connection and use an AWS integration for host information.
CloudWatch Database Insights is the AWS-native starting point for database load and supported analysis. SQL-focused products add different workflows for plan history, waits and estate alerts. The useful comparison is whether the tool collects from the database, AWS or both, and which evidence survives a failover, an endpoint change or a short performance incident.
Amazon RDS for SQL Server monitoring tools at a glance
AWS access and SQL Server access are separate. Verify which features remain available if the collector has only a SQL login or only AWS read permissions.
| Tool | Collection path | What to investigate | Verify before buying |
|---|---|---|---|
| CloudWatch and Database Insights | AWS metrics, DB load mode and enabled managed logs | Resource alarms, DB load and Advanced plan evidence where supported | Engine, Region, mode, access, retention and pricing |
| Redgate Monitor | Supported RDS SQL connection and applicable AWS integration | RDS and SQL Server diagnostics in one estate | Exact SQL grants, optional AWS data and monitored target scope |
| SolarWinds DPA | Documented RDS for SQL Server registration | SQL wait analysis and retained query information | DPA permissions, target registration and billing |
| IDERA SQL Diagnostic Manager | Supported managed SQL Server monitoring path | RDS views, SQL activity and alerts | RDS-specific grants and supported product release |
| Quest Foglight for SQL Server | Foglight SQL Server cartridge and configured cloud collection | Workload analytics and SQL PI when applicable | Version, edition, SQL permissions and AWS coverage |
| Datadog Database Monitoring | Agent SQL Server connection plus optional AWS integration | Query metrics, samples and plan evidence when captured | Check RDS-specific permissions, agent reachability and plan charges |
| ManageEngine Applications Manager | AWS RDS monitoring and separately configured database data | RDS capacity, alarms and extra SQL evidence by deployment | IAM permissions, SQL application monitor and licensing units |
| SQLGrease | Supported network connection to RDS SQL Server | Query and wait history in the configured deployment | RDS permissions, retention and collector settings |
Amazon CloudWatch Database Insights
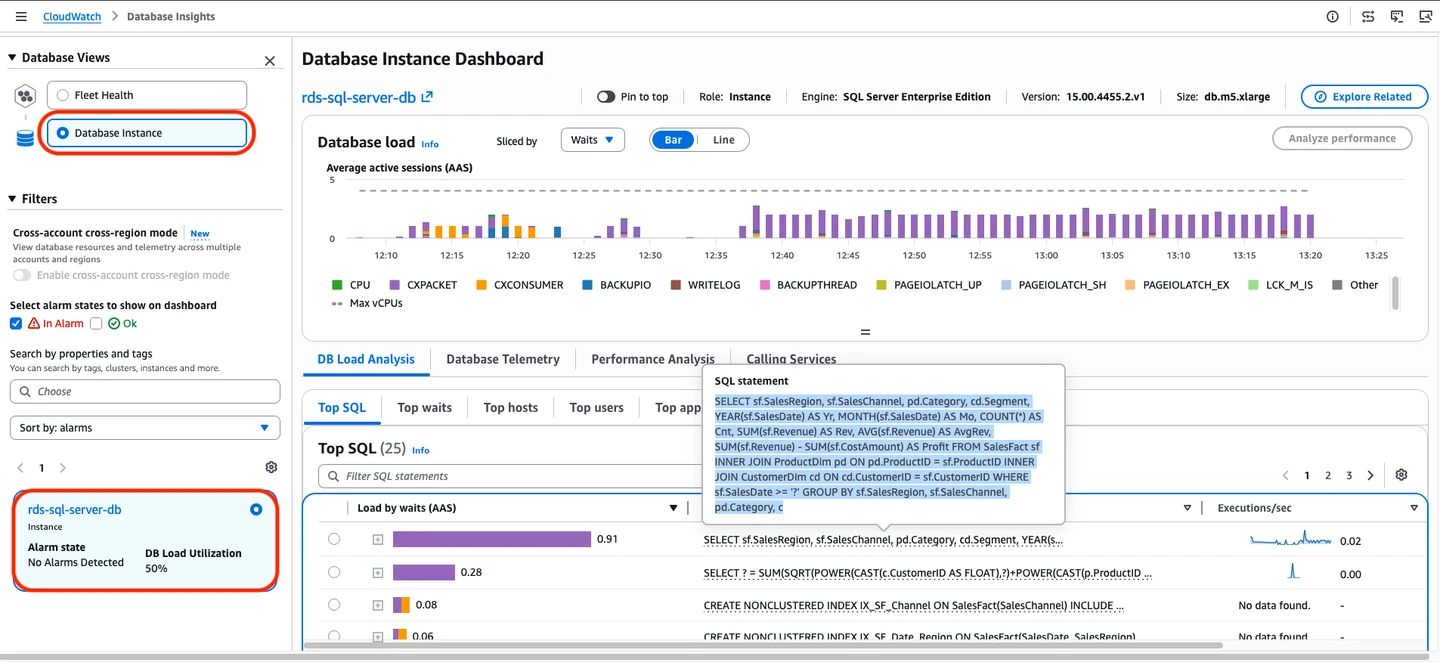
Amazon CloudWatch Database Insights visualizes database load for supported RDS SQL Server instances and can break activity down by factors such as waits and SQL statements. AWS documents execution plan analysis for supported RDS SQL Server instances in Advanced mode. It is useful when the operations team already works primarily in AWS.
Standard and Advanced modes offer different capabilities, and supported settings can vary by class, region and engine. Database load, CloudWatch logs and AWS host metrics have separate collection paths. A plan view for a digest is most useful when the associated wait and time data are available for the incident.
Start with AWS/RDS metrics for the instance and CloudWatch alarms. Open Database Insights for database load. AWS documents SQL Server plan analysis for eligible Advanced-mode configurations. It distinguishes this from lock-analysis features documented for other engines.
AWS lists July 31, 2026 as the Performance Insights end-of-life date and directs users to Database Insights. The RDS guide still documents the Performance Insights API. Verify mode-specific requirements, retention and CloudWatch costs for your Region.
- Compatibility
- Supported RDS SQL Server instance. Plan analysis requires eligible Database Insights Advanced mode.
- License and trial
- AWS charges depend on mode, retention and other configured telemetry.
Redgate Monitor
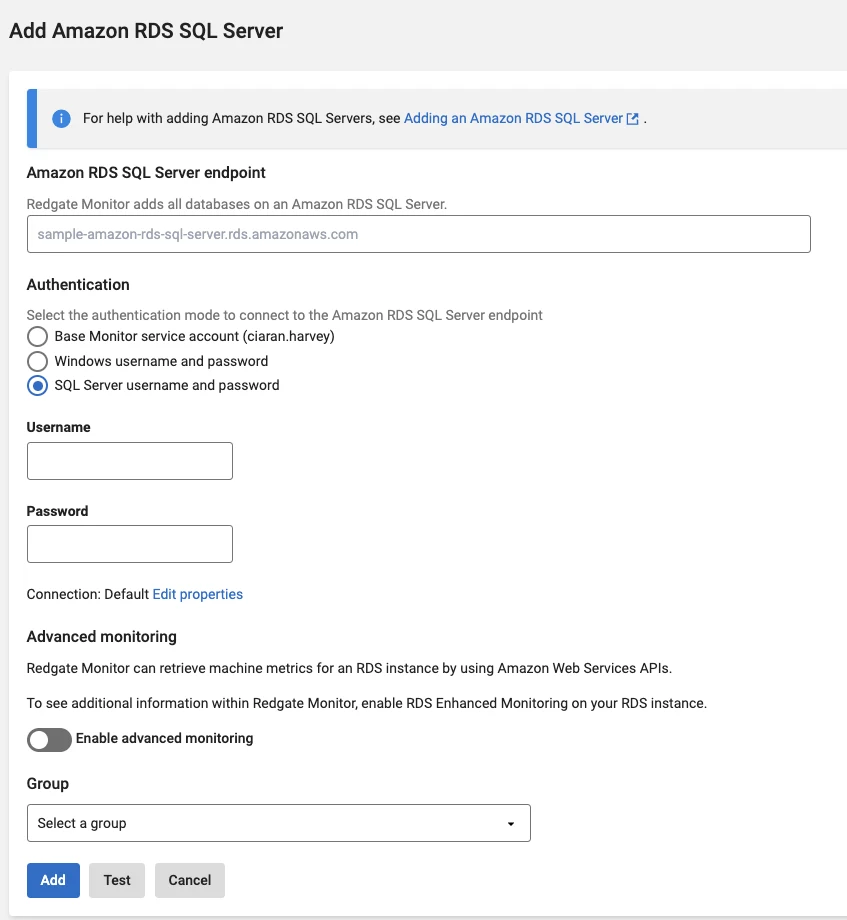
Redgate Monitor supports Amazon RDS SQL Server by connecting to the RDS endpoint and can add host metrics using AWS credentials. Its SQL Server views help an operator relate an incident to the instance’s query and wait activity while following the same alert process used for other monitored servers.
Its strength is consistent operations across managed and self-managed SQL Server. Redgate distinguishes what it reads through the database connection from AWS API and Enhanced Monitoring data. The chosen permissions and enabled integrations determine how much of the RDS environment appears in a comparison.
Follow the RDS target instructions and use the published SQL Server permissions for the intended monitoring purpose. Verify RDS endpoints and transport security separately from any AWS integration that provides resource metrics.
Test whether the same blocked request can be found after it completes. Compare the SQL activity with the CloudWatch CPU or storage alarm. Record what is unavailable with a SQL-only credential and whether it matters to the team.
- Compatibility
- Redgate Base Monitor with access to the RDS endpoint. Host metrics require the appropriate AWS integration.
- License and trial
- Commercial Redgate licensing. AWS monitoring features can have separate charges.
SolarWinds Database Performance Analyzer
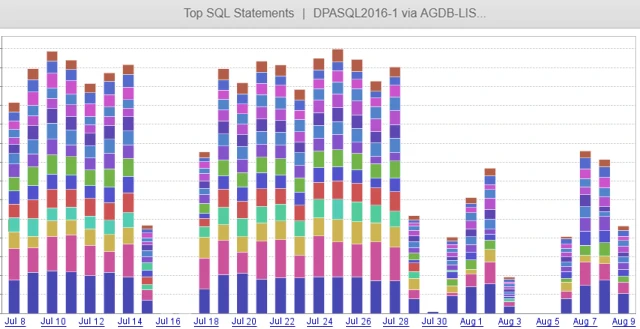
SolarWinds Database Performance Analyzer can register an Amazon RDS for SQL Server instance and organize collected query activity around waits. That is useful when a DBA wants to identify the statements responsible for long waits without depending on direct access to the managed Windows host.
It fits teams that want the same wait-based view on RDS and other database platforms. RDS exposes a different set of metrics and permissions from a self-managed instance. The DPA repository, monitoring connection and metric coverage all matter when evaluating how much evidence can be retained.
Use the product's Amazon RDS registration workflow rather than copying the self-managed setup. Confirm the monitoring account and repository can reach the correct SQL Server endpoint. Verify server and database scopes.
Exercise DPA's wait-oriented view on an isolated workload while capturing a native blocking sample. Confirm which wait and query evidence persists afterward. Quote the same RDS target inventory used in the AWS baseline.
- Compatibility
- DPA with a supported RDS SQL Server connection and monitoring permissions.
- License and trial
- Commercial SolarWinds DPA license.
IDERA SQL Diagnostic Manager
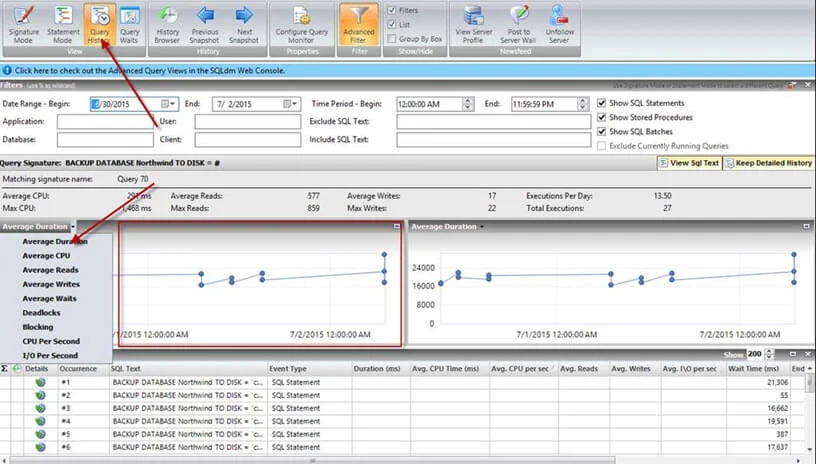
IDERA SQL Diagnostic Manager provides RDS-specific views and documents minimum and recommended permissions for Amazon RDS targets. It is useful when a SQL Server team wants cloud instances in the same operations console as its other SQL Server installations.
The practical strength is monitoring within the SQL Server-specific workflow. RDS access restrictions affect collection, and more detailed host or AWS resource information depends on the applicable setup. The product’s permissions documentation helps clarify which capabilities are available to the chosen account.
Use the RDS resources and version-specific SQL Diagnostic Manager instructions to confirm which views work on the required SQL Server edition. Test applicable permissions with the intended account.
Compare historical SQL activity with the RDS service metrics in the same interval. Record the fields and scope actually collected. Check an alert from the managed database before relying on a self-hosted SQL Server alert configuration.
- Compatibility
- SQL Diagnostic Manager with a supported RDS SQL Server target and applicable permissions.
- License and trial
- Commercial IDERA license. Additional AWS services may have separate terms.
Quest Foglight for SQL Server
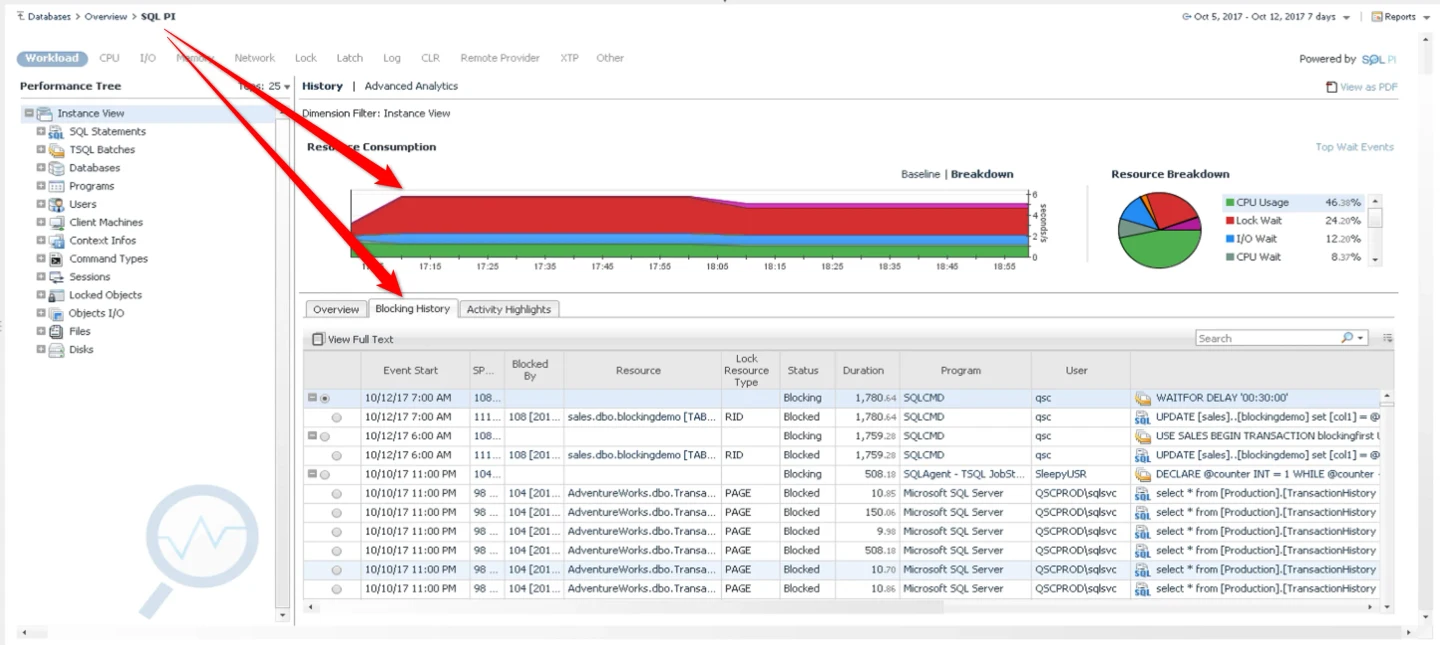
Quest Foglight can monitor SQL Server deployments including supported Amazon RDS targets. Its SQL Server cartridge and available SQL Performance Investigator views help a team investigate queries, waits and blocking. This is useful when an organization already monitors multiple databases through Foglight.
Its advantage is a shared monitoring workflow for an estate that crosses engines or platforms. The RDS deployment, Foglight agent and database permissions determine the available detail. SQL PI coverage and AWS metrics should be assessed against the incidents the team actually needs to support.
Check the SQL Server cartridge release notes for your Amazon RDS engine. Identify the SQL account, collector network and any required AWS permissions. Test the capabilities enabled in the product you would purchase.
Run the same incident in the relevant SQL Server view or SQL Performance Investigator when configured. Compare session evidence and actual retained history. Verify the estate and retention implications for the proposed license.
- Compatibility
- Supported Foglight version, SQL Server cartridge and access to the RDS endpoint.
- License and trial
- Commercial Quest monitoring and optional capability terms.
Datadog Database Monitoring
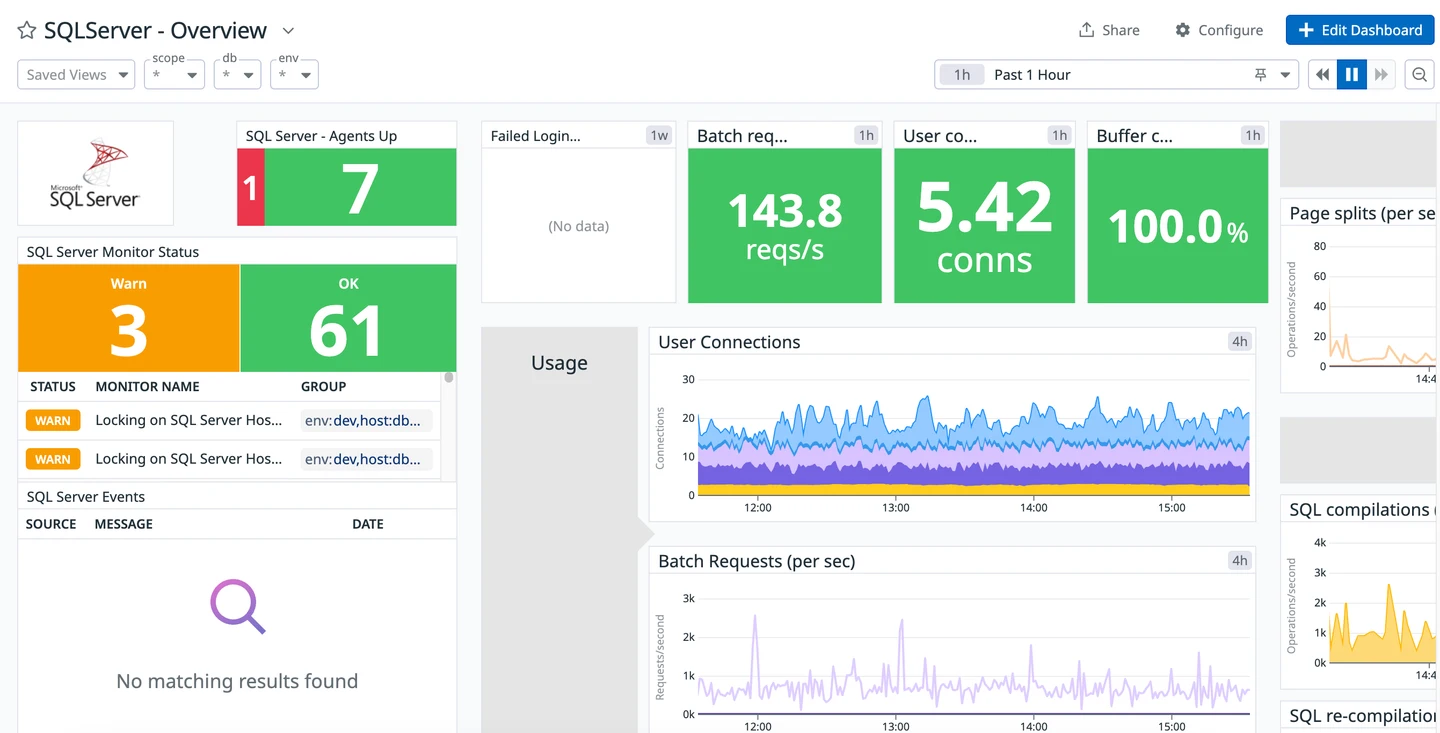
Datadog Database Monitoring documents a SQL Server on Amazon RDS setup, with an Agent collecting database metrics and samples. This is useful when the team also monitors applications and AWS infrastructure in Datadog and wants to connect a SQL slowdown with the affected service.
Its strength is correlating SQL activity with application and cloud signals. The RDS configuration needs supported database credentials, and monitoring the AWS resource requires its own integration. Sample and plan detail can vary, especially when the target platform restricts access to particular metadata.
Use the RDS-specific Datadog instructions and verify the Agent can reach SQL Server. Check each scoped grant on the intended engine version. Configure the AWS integration separately if you want RDS metrics as well.
Use known UTC activity to compare query and plan samples with the native results. Establish which samples are missing under the configured thresholds. Verify detection, retention, data scope and cost for the exact plan.
- Compatibility
- Datadog Agent with RDS SQL Server connectivity. AWS integration can add account and resource metrics.
- License and trial
- Commercial Database Monitoring and applicable AWS and Datadog infrastructure terms.
ManageEngine Applications Manager
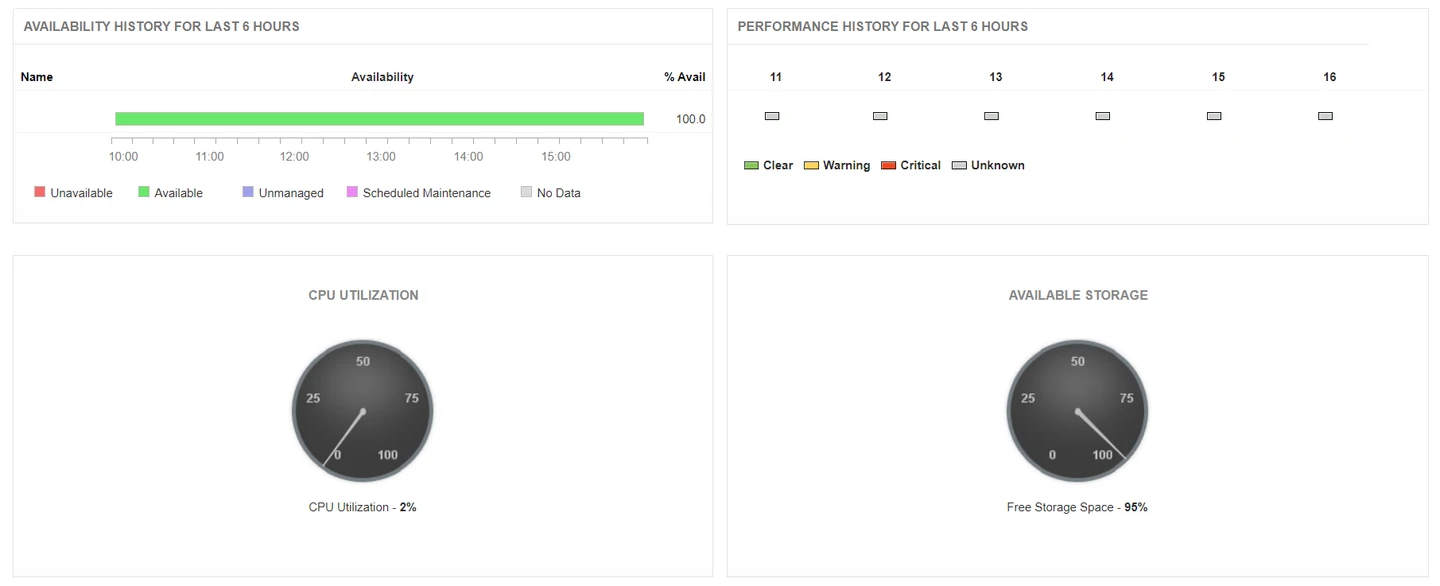
ManageEngine Applications Manager provides an Amazon RDS instance monitoring workflow and separate Microsoft SQL Server monitoring. This fits teams that need RDS resource alerts beside other infrastructure and application data. The RDS view is useful for understanding the service’s footprint and resource symptoms.
The relevant comparison is which signals come from AWS and which require a SQL Server connection. A service-level alert can show high usage without explaining a particular query. Where SQL detail is important, the supported database monitor and credentials determine what can be investigated.
Set up the documented RDS monitor with the required AWS access. Confirm that the alert reads the intended resource and dimension. Determine whether SQL query evidence needs its own database monitor and login.
Compare resource alarms and historical charts with a native SQL Server sample. Record collection delay and review retention. Check how AWS integration and database monitoring count toward the deployed license.
- Compatibility
- Applications Manager with the applicable AWS permissions and optional SQL Server connectivity.
- License and trial
- Commercial monitoring plan. AWS telemetry and collection can have separate charges.
SQLGrease
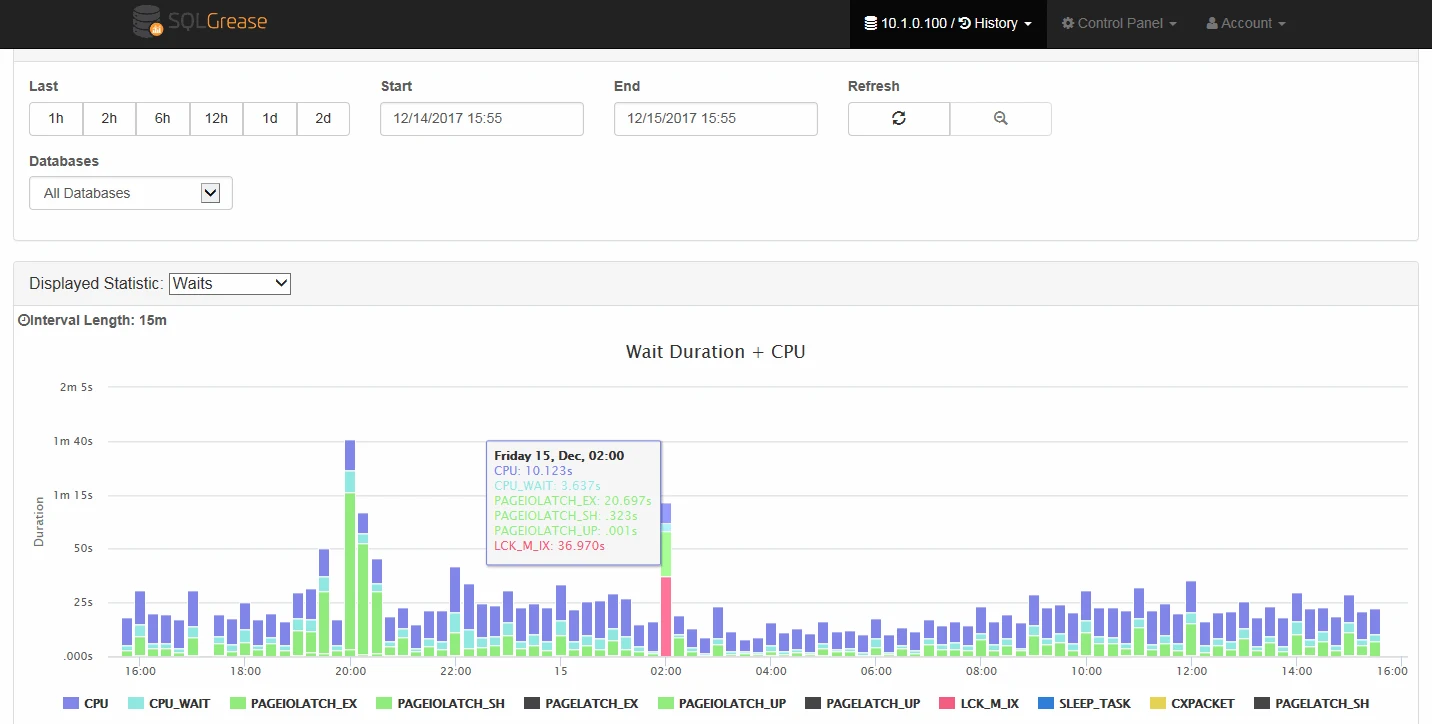
SQLGrease collects SQL Server query performance, execution plans and wait or blocking evidence. It is useful for teams that want to focus on what the database workload did, including the conditions under which a statement got slower. The vendor documents SQL Server monitoring for cloud deployments.
Its strength is query-level investigation over an established database connection. That is a different task from managing AWS instance capacity, service events or engine log exports. The supported RDS connection and collection permissions determine what SQLGrease can record.
Verify the supported RDS SQL Server setup and monitoring permissions in the installed release. Use a known query and blocking period to test which aspects of the SQL workload the product identifies.
Compare the retained statement and wait evidence with an AWS resource alarm at a known time. Verify the client or collector network, time-zone configuration and monitoring scope.
- Compatibility
- Supported SQLGrease monitoring setup with RDS endpoint access and appropriate database permissions.
- License and trial
- Commercial SQLGrease monitoring plans.
Which monitor fits your Amazon RDS SQL Server?
| What you need | Tools to shortlist | What to verify |
|---|---|---|
| Monitor one RDS estate using AWS permissions and dashboards | Check which metrics, logs and DB load dimensions are enabled for the actual database instance, including mode, AWS Region and retention. | |
| Investigate SQL Server waits, expensive statements and plans | Find a known query in the test window. Verify capture thresholds, monitoring permissions, plan details and retention. | |
| Use the same DBA workflow for managed and self-managed SQL Server | Add an actual Amazon RDS target and compare its supported views with the features you expect from an existing deployment. |
Choose between RDS resource telemetry and SQL diagnostics
There are separate credentials and retention policies for AWS metrics, exported logs and direct SQL Server monitoring. Write down which views require IAM, which require SQL grants and which are collected by the managed service.
CPU or free storage crossed a service threshold
Start with AWS/RDS and a CloudWatch alarm
Use the instance identifier, time range and chosen metric.
Load rose and you need query or plan context
Use Database Insights or a supported SQL collector
Check mode, engine, sampling and history before assuming plan availability.
You need the exact blocker or database login path
Compare a scoped SQL Server observation
Check effective grants and what the chosen collector can retain.
- AWS CloudWatch Database Insights
- Redgate Monitor for Amazon RDS SQL Server
- SolarWinds DPA RDS SQL Server setup
- IDERA Amazon RDS resources
- Quest Foglight SQL Server compatibility
- Datadog DBM for RDS SQL Server
- ManageEngine Amazon RDS instance monitoring
- SQLGrease release notes and RDS support
- AWS CloudWatch metrics for Amazon RDS
- AWS RDS Advanced Database Insights configuration
- AWS Database Insights execution-plan analysis
- AWS RDS monitoring and Performance Insights API
Align an RDS resource alarm with a SQL Server observation
Keep the AWS resource and SQL instance identities side by side. Record a small controlled lab block and a separate alarm or planned low-risk metric event. Use UTC everywhere. Sharing a time window helps investigation without establishing that one event caused the other.
The SQL query reports currently blocked requests visible to its login. Compare this short-lived evidence with what each product captured. AWS documents Database Insights plan analysis for eligible Advanced-mode RDS for SQL Server targets. Its documented guided lock-analysis feature has different engine coverage.
| Step | Interface | Required evidence |
|---|---|---|
| Select instance and alert | CloudWatch AWS/RDS | Resource identity, metric, dimension, evaluation window and time |
| Investigate database load | Database Insights for the configured mode | Load and any supported SQL or plan evidence |
| Observe the lab blocker | SQL Server session with scoped permission | Database, blocker, waiter, wait type and UTC timestamp |
| Reopen the incident | Selected vendor or AWS view | Check retained event, query sample and collector scope |
How to compare these tools
Use the same RDS instance and a supported monitoring login. Trigger load and a blocking case. Check which details the product can collect through AWS and SQL Server without assuming host access. Sources checked .
- AWS CloudWatch Database Insights modes and Performance Insights transition
- AWS RDS Database Insights engine, Region and instance support
- AWS RDS CloudWatch metric definitions
- AWS Enhanced Monitoring guest OS metrics
- AWS RDS SQL Server security and role restrictions
- AWS RDS for SQL Server error and Agent log export
Check the same workload window in AWS and the SQL monitor
Use a disposable RDS for SQL Server database that your team already administers. Create an approved blocking event with two lab sessions and use a separate monitoring connection for the read-only probe. Record the AWS instance identifier and Region separately.
Identify the RDS SQL Server context and visible blocking
T-SQL · 13 lines
- Record endpoint, Region, database and UTC time. Check the observer's effective permissions before starting the lab workload. Verify AWS and SQL collection credentials independently.
- Cause a short, deliberate block using two lab sessions and a synthetic row. Capture observer output and note when the sessions finish. Compare with CloudWatch's sample timing and the collector's history.
- Align the block with a known resource-alarm exercise or a historical test alarm. Evaluate what remains available after the event and what the chosen plan and retention actually store.
Conclusion
Use CloudWatch to establish which RDS resource or database changed. Trial an additional monitor when the operator needs query context, historical blocking or a common workflow across platforms. Ask for the exact RDS collection path and plan or retention entitlement before comparing prices.
Frequently asked questions
What should I monitor on Amazon RDS for SQL Server?
Start with CPU utilization, free storage, connections, I/O and DB load. Add query waits, blocking and SQL Server error logs for diagnosis. Use the RDS instance identifier, Region and the same time window across the views.
How do CloudWatch metrics and Database Insights work together?
RDS CloudWatch metrics report managed instance measures such as CPU and storage. Database Insights adds database load and SQL dimensions on supported targets. Enhanced Monitoring provides guest OS measurements, and RDS log exports are configured separately.
Can I still use the Performance Insights console for RDS?
AWS lists July 31, 2026 as the end of the Performance Insights console experience and directs users to CloudWatch Database Insights. AWS still publishes the Performance Insights API reference. Review the current Database Insights mode and retention for the instance.
Do I need sysadmin to monitor RDS for SQL Server?
AWS reserves the sysadmin role and assigns managed privileges to the RDS master user. Follow the vendor's RDS-specific collection instructions and verify the SQL and IAM permissions for the enabled features.
Can RDS for SQL Server send error logs to CloudWatch?
Yes. Amazon RDS can export SQL Server error and Agent logs to CloudWatch Logs. Enable the required exports and verify retention, SQL access and any alerts using a known entry.
Does Database Insights show the same SQL Server blocking detail as a live SQL observer?
Check the feature, engine and configured mode. Use the native request sample or a SQL Server collector for the exact blocker relationship and compare it with the database load and plan data available in AWS.