

SQL Sentry and Redgate Monitor both help a DBA investigate slow SQL Server work, but they organize the investigation differently. SQL Sentry brings Top SQL, blocking chains and plan analysis together. Redgate Monitor puts queries and blocking into a larger instance timeline and alert workflow. The best fit depends on whether the team spends more time examining difficult incidents or keeping a wider estate under routine observation.
A visible blocking chain answers who waited and who held the lock at a point in time. Query plans, waits and workload history answer other parts of the incident. The useful comparison is which evidence the tool captures before the issue disappears, how the operator can move from an alert to the affected statement and how much history the collection retains.
SQL Sentry vs Redgate Monitor at a glance
Use the same SQL Server, observable event and collection window. The first two rows are the direct comparison. Other monitors are useful controls where the workflow differs.
| Tool | Strong starting point | Evidence to test | License or deployment check |
|---|---|---|---|
| SolarWinds SQL Sentry | Detailed server-side blocking investigation | Blocking SQL history, chain detail and plan context where captured | Check monitored targets, DBSH terms and collector or repository setup |
| Redgate Monitor | Instance health, alerts and time-based blocking investigation | Historical blocking, SQL text and scope of retained conditions | Check monitored-server terms, editions and source connectivity |
| SolarWinds Database Performance Analyzer | Wait-oriented query analysis | Top queries, waits and matching event timing | Confirm DPA entitlement and its approach to the same case |
| IDERA SQL Diagnostic Manager | SQL Server monitoring with blocked session workflow | Head blocker, retained history and notification | Check monitored-instance coverage and licensing |
| Quest Foglight for SQL Server | Fleet monitoring with a SQL Server cartridge | Blocked session, query and affected workload | Check SQL PI scope or applicable Foglight options |
| Datadog Database Monitoring | Query samples, metrics and estate context | Plan or query sample and timing of locks | Verify agent, entitlement and monitored target |
| dbWatch Control Center | Operational SQL Server monitoring across instances | Blocking data, job configuration and retained result | Check collector setup, scope and edition terms |
| SQLGrease | Historical SQL Server query investigation | Query history, event timing and permissions | Verify collector coverage, retention and billing |
SolarWinds SQL Sentry
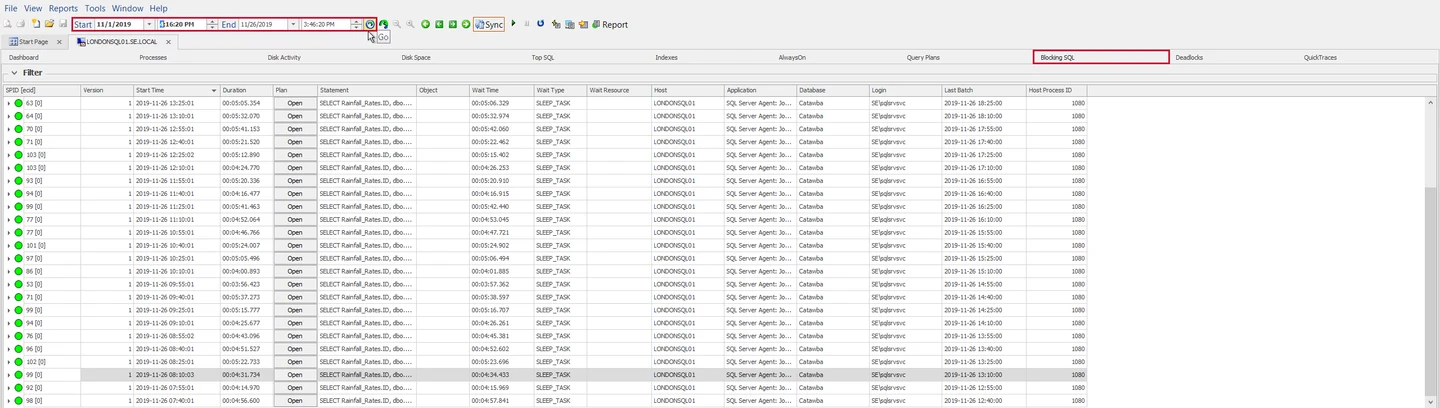
SolarWinds SQL Sentry exposes Top SQL and blocking analysis alongside plan history and integrated Plan Explorer. It is useful when a DBA needs to connect a blocking chain or a change in query duration to the activity of a particular SQL Server session or plan.
Its strength is the depth of the SQL Server incident view. Thresholds, sample intervals and retention influence which short-lived events appear. The team also needs to know whether it is examining the original statement, the root blocker or a victim that spent most of its time waiting.
Use the documented Blocking SQL view and capture the same UTC interval that the native observer samples. Check who the tool identifies as the lead blocker and whether it exposes the blocked statement, wait resource or related SQL after the transaction ends.
Test retention, defaults and alert thresholds in the installed configuration. For procurement, compare the monitored target list against the current DBSH terms. Keep repository and monitoring service requirements with the quote.
- Compatibility
- SQL Sentry with supported SQL Server monitoring and the relevant collection settings.
- License and trial
- Commercial SolarWinds product.
Redgate Monitor
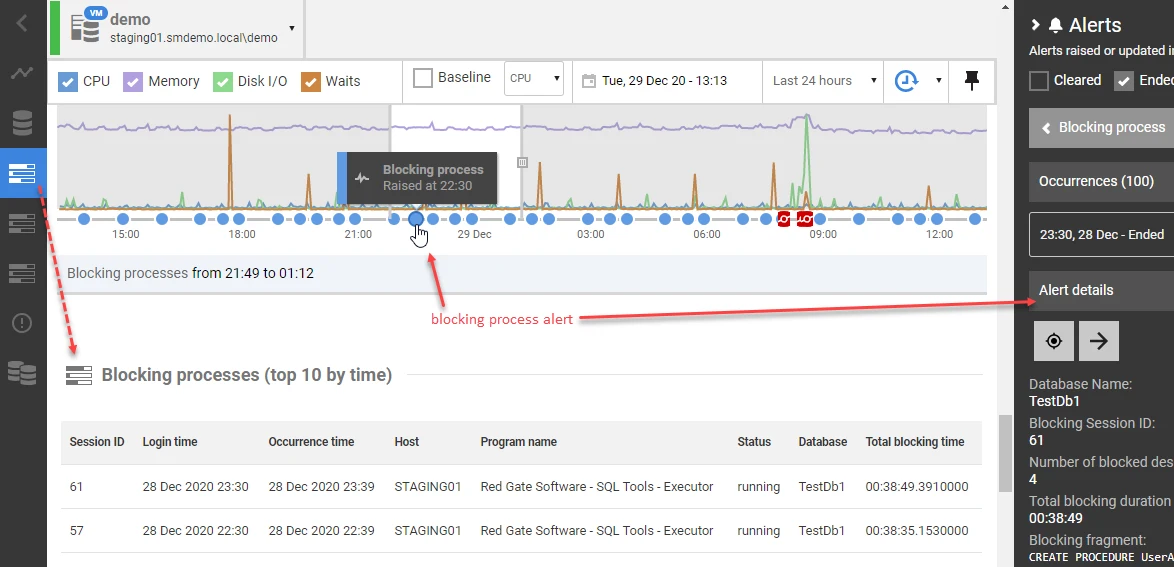
Redgate Monitor collects SQL Server query activity, instance metrics and alerts. Its blocking views and Top Queries help an operator move from a reported incident to the queries and time window involved. This is useful when the same person maintains routine alerts and investigates intermittent blockers.
The advantage is a common incident and estate workflow. Some blocking and query details depend on the source and Extended Events setup. Its coverage matrix matters for mixed SQL Server estates because a managed service and a self-managed Windows instance can expose different evidence.
Use the documented blocking investigation workflow for the affected monitored instance and time range. Check whether the lead blocker and its affected sessions can still be inspected after they leave the live process view. Record the SQL and wait detail available.
Try the intended alert rule on the same blocking interval and collect delivery time. Map the licensed server and any edition feature to your estate. Check that the available query or plan evidence is adequate for the people who review alerts.
- Compatibility
- Redgate Monitor with the relevant SQL Server access and collection permissions.
- License and trial
- Commercial monitoring license.
SolarWinds Database Performance Analyzer
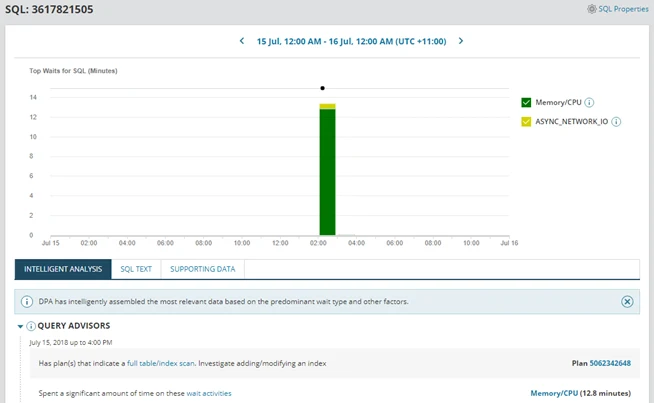
SolarWinds Database Performance Analyzer focuses on database waits and the statements driving them. It tracks baselines and can highlight exceptional delays. It is useful when the first question is where response time accumulated and whether the same kind of wait has appeared on other monitored databases.
Its wait-oriented workflow fits estates with several database engines or teams that prefer to start from resource delay. Polling and target permissions affect what is visible. A retained wait sample can show a symptom while a complete blocking chain or plan investigation may require other evidence.
Use the DPA query investigation workflow to find the same interval through waits and statements. Record the affected SQL Server identity and query. Compare which detail can be recovered without relying on SQL Sentry's interface.
Check the alert and plan path in the DPA deployment that would be purchased. Keep collection windows aligned with the native samples and note the time range and entitlement in the report.
- Compatibility
- DPA repository and compatible SQL Server monitoring connection.
- License and trial
- Commercial SolarWinds DPA licensing.
IDERA SQL Diagnostic Manager
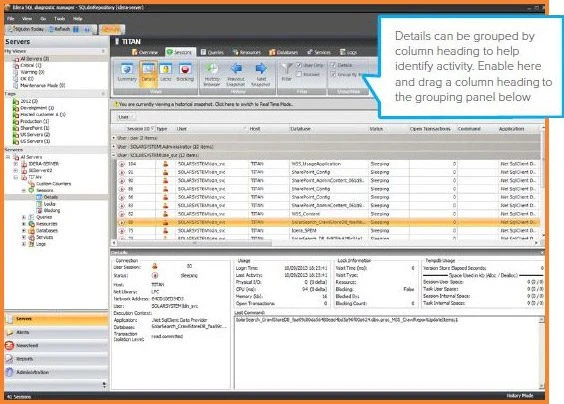
IDERA SQL Diagnostic Manager monitors SQL Server sessions, blocking and performance and provides an Analyze Blocked Sessions workflow. It is useful when a DBA wants to inspect blocked sessions alongside instance health and use the same product to manage ongoing SQL Server alerts.
It fits operations teams that want a SQL Server-specific monitoring console. The collector configuration determines which sessions and history can be examined later. A useful comparison includes how quickly the team can find the root blocker and what evidence remains once the block has cleared.
Confirm the blocked-session collection mode and SQL permissions for the installed release. Use the same test to identify waiting and blocking sessions and compare the data after both sessions complete.
Try a controlled notification and check whether retained evidence includes the head blocker or only the affected session. Match those findings to the licensed monitoring setup.
- Compatibility
- SQL Diagnostic Manager with supported SQL Server versions and collection permissions.
- License and trial
- Commercial IDERA licensing.
Quest Foglight for SQL Server
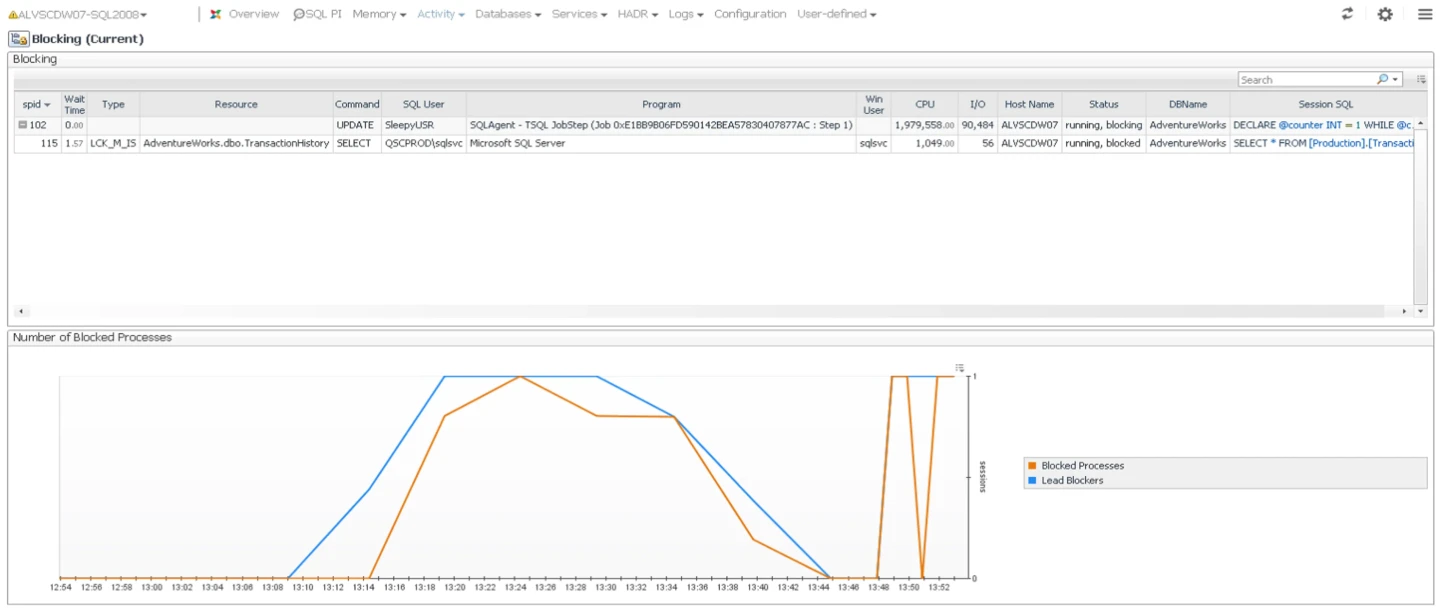
Quest Foglight for SQL Server can examine blocking and waits through its SQL Server monitoring and SQL Performance Investigator features. It is useful in an estate where operators need to investigate SQL Server as one part of a broader database monitoring practice.
The strength is correlating several performance dimensions in the same period. Query, blocker and plan detail depends on the deployed cartridge and SQL PI configuration. That deployment work pays off when a team also needs the shared monitoring workflows Foglight provides.
Use the SQL Server cartridge's blocking or workload investigation view and check the data collected by the installed version. Compare the result with the operator's native observer session at the same UTC time.
Identify whether retained query inspection, plan context and alert history are part of the exact Foglight product setup. Verify one blocking chain and one remediation path before generalizing the result.
- Compatibility
- Foglight with the applicable SQL Server cartridge and collection capabilities.
- License and trial
- Commercial Quest monitoring product.
Datadog Database Monitoring
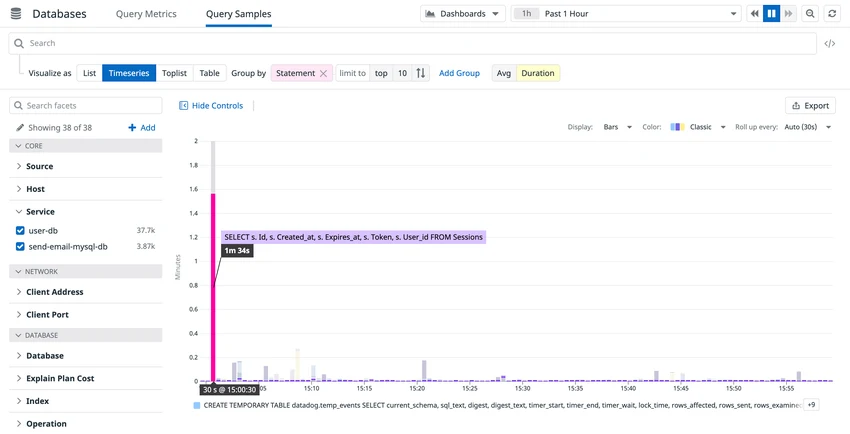
Datadog Database Monitoring shows normalized query performance, samples and related database signals. It can put SQL Server performance near infrastructure and application data in a Datadog investigation. This is useful when many incidents begin with an application latency alert.
The benefit is following a slow application request into its database context. Query normalization and sampling determine what can be tied back to a specific execution. A production comparison should account for how each product captures short blocks or parameter-sensitive queries.
Use the documented SQL Server integration for the test connection and verify which query detail reaches Datadog during the event. Match sample timing and SQL Server grants to the scoped target.
Compare activity, sampled plan or queries and any enabled correlation with the native session IDs. Check the retention required for after-the-fact investigation and applicable agent or database-monitoring costs.
- Compatibility
- Datadog Agent and configured SQL Server Database Monitoring connections.
- License and trial
- Commercial Database Monitoring and applicable infrastructure terms.
dbWatch Control Center
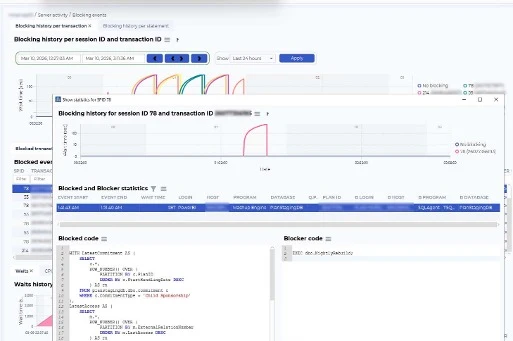
dbWatch Control Center can collect SQL Server blocking events and give operators drill-downs from an estate or instance view. Its database performance package can add a more detailed history. This fits teams that already use dbWatch to combine monitoring with scheduled SQL Server operations.
A configurable collector interval is useful when a team needs to focus on short blocking incidents. The interval and enabled jobs define how much of the activity is retained. The performance package and the base product can cover different operating needs.
Use the same blocking scenario on a monitored test instance. Check what dbWatch collects, which roles are used and how the stored evidence distinguishes the waiting session from the session holding the lock.
Test an alert using the chosen policy and key operations schedule. Give the resulting event to a second reviewer and check whether it still supports a decision after the lab transaction rolls back.
- Compatibility
- dbWatch Control Center with applicable blocking collection jobs and SQL Server privileges.
- License and trial
- Commercial. Detailed blocking features can require the SQL Performance package.
SQLGrease
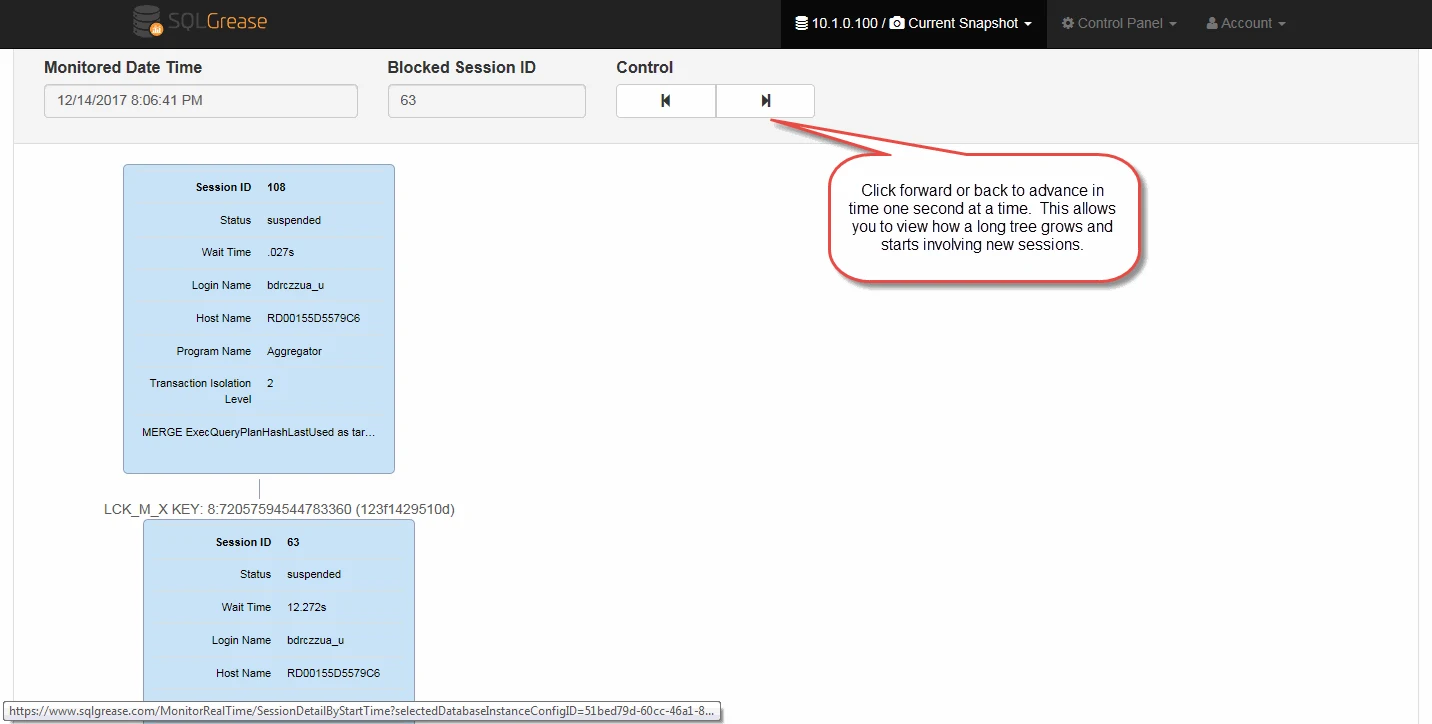
SQLGrease records SQL Server query performance, wait events, historical plan details and lock trees. This is useful when the investigation starts with one query and the operator needs its plan, waits and blocking relationships after the incident is over.
It fits teams that prioritize detailed query and lock evidence. Collection depends on the target permissions and the service’s observation window. A lock tree can explain what was blocked, while wider application or infrastructure events may still be needed to explain why the workload changed.
Check the SQL Server history and blocking evidence exposed by the selected plan and collector. Set the same observation window and verify the time and database markers using the native control.
Compare what was retained after the waiter completes. Look for useful details about the blocking chain, relevant query and wait signals, and record the threshold needed to reproduce that evidence.
- Compatibility
- SQLGrease with supported SQL Server connectivity and collection permissions.
- License and trial
- Commercial monitoring plans.
SQL Sentry and Redgate Monitor features compared
| Feature | SolarWinds SQL Sentry | Redgate Monitor |
|---|---|---|
| Incident history | Performance Analysis combines Top SQL, Blocking SQL and Deadlocks. Use the time range and target to review the captured incident. | Top Queries, Blocking Processes and Alert Inbox are available from the monitored estate. Open the specific blocking chain and the surrounding metrics. |
| Query detail | Top SQL can show statement activity, execution statistics and plans for captured queries. Capture choices affect the retained history. | Top Queries shows query statistics and waits. Check the collected query plan, time bucket and whether execution-level capture applies in your edition. |
| Alert configuration | Conditions and actions route notifications for watched targets. Check the blocking duration and the action assigned to the target. | Blocking thresholds and alerts can be configured for the monitored target. Review threshold inheritance and notification routes. |
| Deployment | Windows monitoring service and SQL Sentry repository. Check the desktop client and optional Portal against the screens your operators need. | Self-hosted deployments use a Base Monitor, a repository and a web UI. Redgate also offers SaaS. Confirm the collection and network setup for the target platform. |
| Collection permissions | SolarWinds documents CONTROL SERVER as a minimum path for a self-managed target in its non-sysadmin scenario. Check the exact features and account model. | Redgate publishes SQL Server and OS permissions by monitoring feature and platform. Check which permissions your chosen edition and features need. |
| Licensing units | SQL Sentry is generally licensed per monitored target. Current documentation uses the Database Self Hosted license type for newer versions. | For self-managed SQL Server, Redgate documents a per-server unit even with several instances. Managed database and replica units follow their own rules. |
Which SQL Server monitor should you trial?
| What you need | Tools to shortlist | What to verify |
|---|---|---|
| Investigate SQL Server incidents using a dedicated DBA monitor | Find the actual blocking session, the statement it held up and what else was running at the time. | |
| Find expensive statements and the waits behind them | Open a query from its wait history. Verify which plan, samples, parameter values and time range the product retains. | |
| Manage routine tasks across a mixed database estate | Check both fleet views and incident detail. Measure collection access, alert routing and time to find an affected instance. |
Choose which blocking evidence the operator needs
An active session view helps diagnose a live block. A historical investigation needs captured context. Review the storage interval, SQL text scope and user permissions that expose the relevant chain.
Inspect and retain a detailed session chain
Trial SQL Sentry Blocking SQL
Check lead blocker, waiting SQL, waits and plan evidence in the captured window.
Start from an incident timeline or alert
Trial Redgate Monitor's blocking workflow
Confirm the alert connects to sufficient retained data for an operator.
Compare fit and cost across the estate
Quote the same target inventory and test access
Check licensing unit, database support, collector permissions and retained evidence.
- SQL Sentry Blocking SQL
- Redgate Monitor blocking investigation
- SolarWinds DPA query investigation
- IDERA blocked sessions
- Quest Foglight SQL Server guide
- Datadog SQL Server integration
- dbWatch SQL Server blocking
- SQLGrease SQL Server monitoring
- SQL Sentry target license terms
- Redgate Monitor editions
- Microsoft SQL Server blocking investigation
Replay one blocking event in both monitors
Use the same lab row, connection order and timestamps. Session A holds a write lock. Session B tries to update the row. An authorized observer samples the blocking relationship until A rolls back and B can finish.
Pick a lab duration that exceeds each tool's configured capture or alert threshold. The example holds a lock for 45 seconds. Record the actual UTC times, session IDs and role permissions. Compare history again after the incident clears.
| Lab event | Native SQL Server evidence | What to check in both monitors |
|---|---|---|
| A starts | A updates one synthetic row in an open transaction | Identify the session and statement |
| B waits | Request reports A as blocking_session_id | Check chain, wait and blocked statement |
| Monitor evaluates | Same SQL Server interval and selected scope | Record alert or view timestamps and any captured plan |
| A releases | A rolls back and B can complete | Observe release or wait duration |
| After the incident | Live chain has ended | Verify which blocker details remain searchable or exportable |
How to compare these tools
Create a short block and a separately identifiable slow query. Check how quickly each tool takes the operator from the alert to the blocked session, statement, plan and time window. Sources checked .
Compare the same blocking incident in both tools
Use an isolated BlockingComparisonTrial database. Run Setup once, then run Blocker, Waiter and Observer in separate connections. The write operations roll back. Run the Observer while the Waiter is blocked.
Create a controlled SQL Server blocking chain in three sessions
T-SQL · 28 lines
- Run Setup once in the disposable database. Begin Blocker, then start Waiter while the lock is held. Save both returned session IDs.
- Run Observer while Waiter is blocked. Compare the returned blocking_session_id and wait with both monitors. Record scope and alert thresholds.
- Once both sessions finish, inspect retained history in both products, including statement, chain, duration and any added plan context.
Conclusion
Shortlist both if diagnosing SQL Server incidents is the main job. Run the blocking trial and have the person on call repeat it from the alert. Use their time to find the head blocker, the access permitted by your environment and the quote for the actual target count to decide.
Frequently asked questions
What is the practical difference between SQL Sentry and Redgate Monitor?
SQL Sentry offers a detailed target-based workflow for Top SQL, blocking and deadlocks. Redgate Monitor combines SQL Server incident diagnostics with views and reports across the monitored estate. Trial the screens your on-call DBA uses and check the deployment requirements.
Can both SQL Sentry and Redgate Monitor show SQL Server blocking?
Yes. SQL Sentry documents Blocking SQL and Redgate Monitor documents Blocking Processes. Both have configurable collection or alert behaviour. A short block may clear before collection or before it meets the alert threshold.
Are SQL Sentry and Redgate Monitor licensed the same way?
SQL Sentry is generally licensed per individually monitored target. Redgate documents per-server licensing for self-managed SQL Server and distinct units for managed targets. Ask each vendor to price the same list of hosts, instances and replicas.
Is SolarWinds Database Performance Analyzer the same product as SQL Sentry?
They are distinct products. Database Performance Analyzer focuses on investigating database waits and query history. SQL Sentry provides target-level SQL Server performance and event views. Current SolarWinds documentation describes a shared Database Self Hosted license type. Confirm your entitlement before deploying both.
How long should a test block last?
Use a disposable database and choose a duration that covers the collector's polling interval and your configured alert threshold. Record the blocking and blocked sessions from SQL Server while they are active. Check that both transactions finish or roll back.
How can I compare blocking history after the sessions end?
Create a controlled block longer than the configured collection window, record both session IDs and timestamps, then check what each product retained. Match the saved lead blocker and waiter to native observer evidence.