

The SQL Server error log contains engine events such as startup messages, login failures and errors written by the server. SQL Server Agent has its own log. A database monitor can turn selected engine messages into alerts with the instance attached. A log platform can keep and search a wider set of messages alongside operating-system and application logs.
The choice depends on whether the primary need is an actionable alert or a searchable history. A useful history survives rotation and keeps the timestamps and multiline messages together. The collection method also changes with the deployment. A server owner can usually read the files or query the engine, while Amazon RDS can publish supported logs directly to CloudWatch.
SQL Server error log monitoring tools at a glance
Distinguish SQL Server alert rules, file collectors and managed service exports. Each has a different boundary for raw log access and retention.
| Tool | Collection approach | What to test | Deployment or billing condition |
|---|---|---|---|
| Redgate Monitor | SQL Server monitoring alerts and applicable error log features | Match expected SQL Server errors to rules and verify retained evidence | Commercial. Verify alert options and deployment support. |
| IDERA SQL Diagnostic Manager | SQL Server alert rules and monitored events | Check exact default and configured alert IDs and source permissions | Commercial. Verify monitored-instance scope. |
| Quest Foglight for SQL Server | SQL Server cartridge, event views and applicable rules | Check error evidence, timing and alert delivery for the cartridge | Commercial. Verify collector and alert coverage. |
| Datadog Log Management | Agent reads the configured log file and sends events | Encoding, multiline processing, rotation and ingestion or retention | Hosted service. Check agent rights and log charging. |
| Elastic Agent and Elasticsearch | SQL Server integration log collection | Path, parser, multiline messages and retention lifecycle | Confirm deployment, indexing and retention costs. |
| Splunk SQL Server add-on | Configured file or supported SQL Server input | Source type, boundary between ERRORLOG and Windows events, and deduplication | Confirm add-on acquisition method, indexing and retention. |
| Grafana Alloy and Loki | Alloy file tailing and Loki queries or alert rules | Positions, rotation, timestamp handling and restart recovery | Self-managed or hosted. Verify storage and retention. |
| Amazon CloudWatch Logs | Provider-supported logs for RDS SQL Server | Export setting, log stream, alert rules and age limits | RDS configuration and CloudWatch ingestion, retention or query terms. |
Redgate Monitor
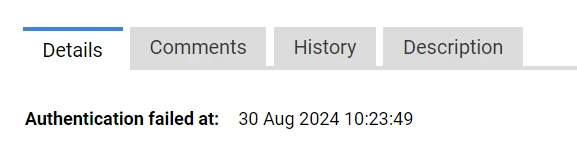
Redgate Monitor can raise an Error log entry alert when SQL Server writes a message above the configured severity. Its alert displays details of the entry beside the monitored instance. This is useful when a DBA wants engine errors in the same queue as other SQL Server incidents.
The setup is useful for triage and alert routing. The severity filter determines which events reach the team, while a separate log retention policy determines how far back an investigation can go. It fits environments already monitored by Redgate where the supported deployment exposes the required log data.
Use the published alert definitions to identify which messages can feed the selected alert. Compare the fired event with what SQL Server actually wrote. Retain the instance, filter and collection time with the result.
Test time to notification and verify what the reviewer can still see after rotation. If the daily workflow requires searching all raw entries, check which data is retained in your chosen product configuration.
- Compatibility
- Redgate Monitor with access to the relevant SQL Server logs. Alert support varies by deployment.
- License and trial
- Commercial monitoring license.
IDERA SQL Diagnostic Manager
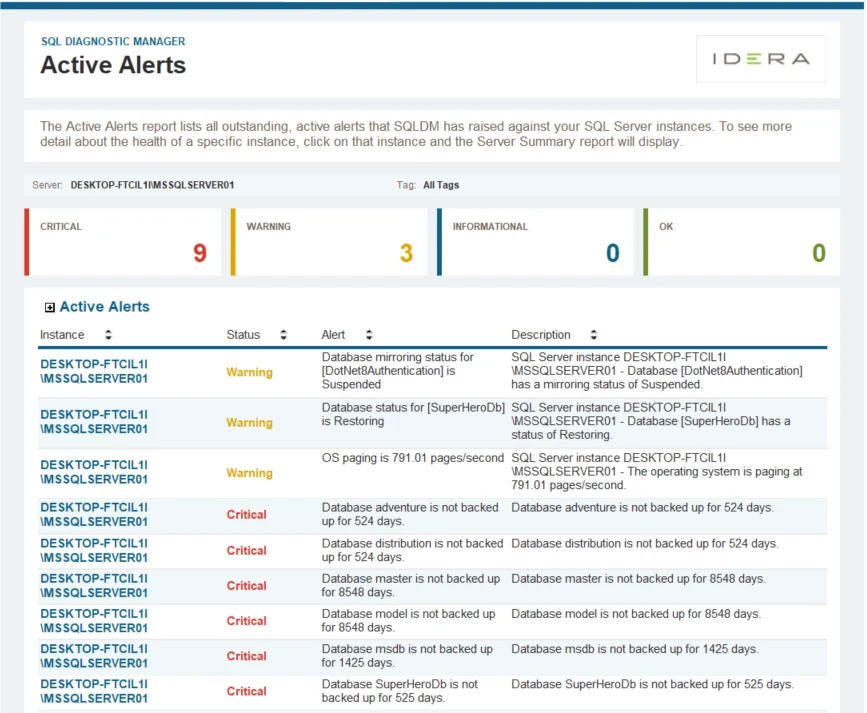
IDERA SQL Diagnostic Manager provides views for SQL Server logs and configurable text or expression alerts. The combination lets an operator find a recurring message and bring selected log entries into the SQL Server monitoring workflow. It is useful when DBAs already use SQL Diagnostic Manager for instance alerts.
It fits predefined operational messages such as repeating login or storage errors. The text filter and severity settings determine what the product reports, so the same alert can behave differently after a message or logging change. Historical search depends on the logs and retention the monitor can access.
Review the selected SQL Diagnostic Manager build's alert IDs and match the SQL Server log conditions you intend to detect. Use a controlled informational marker for capture testing and a separate approved rule for an alert test.
Check how a rotating log and an unavailable server appear to the operator. Export the actual evidence and note the retention window. Confirm which monitoring permissions and SQL Server versions are supported.
- Compatibility
- SQL Diagnostic Manager with a supported SQL Server target and log access.
- License and trial
- Commercial IDERA license.
Quest Foglight for SQL Server
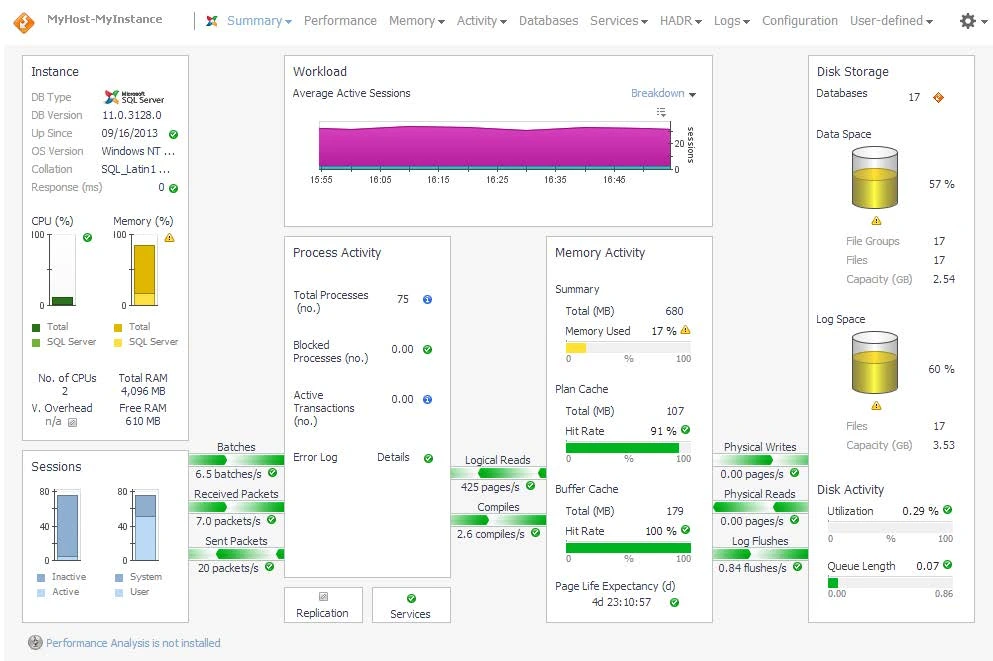
Foglight for SQL Server provides a SQL Server log monitoring workflow within its broader estate views. It gives a DBA a way to inspect engine messages beside information about the monitored instance. This is useful when the operator starts an investigation with a server or database name.
Its strongest case is using an existing Foglight deployment to follow selected operational events. The collection and viewing scope depend on the SQL Server cartridge and credentials. Long-term retention or cross-application search has its own storage and discovery requirements.
Use the SQL Server cartridge guide for the intended release and pick a narrow test instance. Inspect where an error entry appears and how its timestamp is presented. Register which rule, if any, turns it into a notification.
Test rotation and monitor restart independently before comparing arrival time. Check whether evidence appears in a retained event or only in a live view. Record calculation of the alert window and underlying SQL Server permissions.
- Compatibility
- Foglight for SQL Server with its collection agent and appropriate monitored-instance permissions.
- License and trial
- Commercial Quest monitoring product.
Datadog Log Management
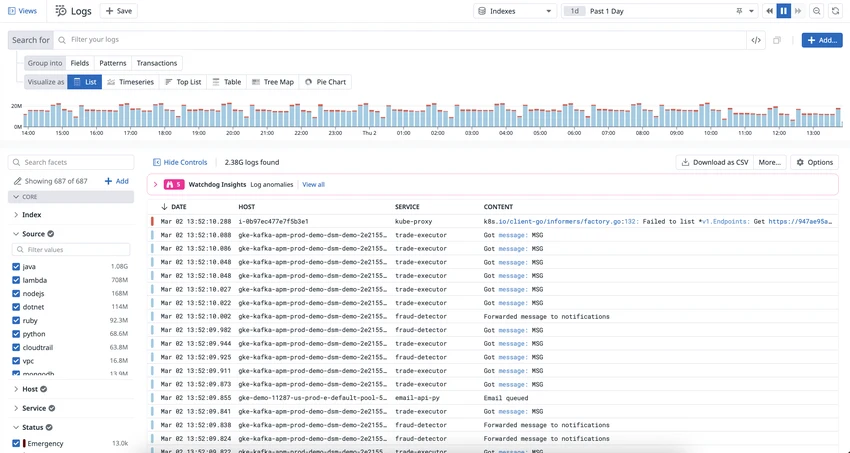
Datadog Log Management can collect SQL Server error log files through a configured Agent and index them for search and alerting. That is useful when an incident spans SQL Server, the host and an application already monitored in Datadog. Tags help connect the events back to an instance and environment.
The collection configuration is part of the result. An agent needs access to the file, and rotation and multiline handling affect which events are retained and how they appear. The chosen ingestion, indexing and retention settings determine both search history and cost.
Configure a log source pointing at the SQL Server service's actual ERRORLOG path. Verify file permissions, timestamp and line grouping. Keep an identifier for the source so a SQL Server event and a Windows event are not counted as the same acquisition path.
Compare both markers after rotation, then restart the collector and run the test again. Review log routing, parsing and retention rules. Estimate billing with the observed ingestion volume rather than just the SQL Server instance count.
- Compatibility
- Datadog Agent or a supported ingestion path with access to the SQL Server logs.
- License and trial
- Commercial log management. Ingestion, retention and other products have separate terms.
Elastic Agent and Elasticsearch
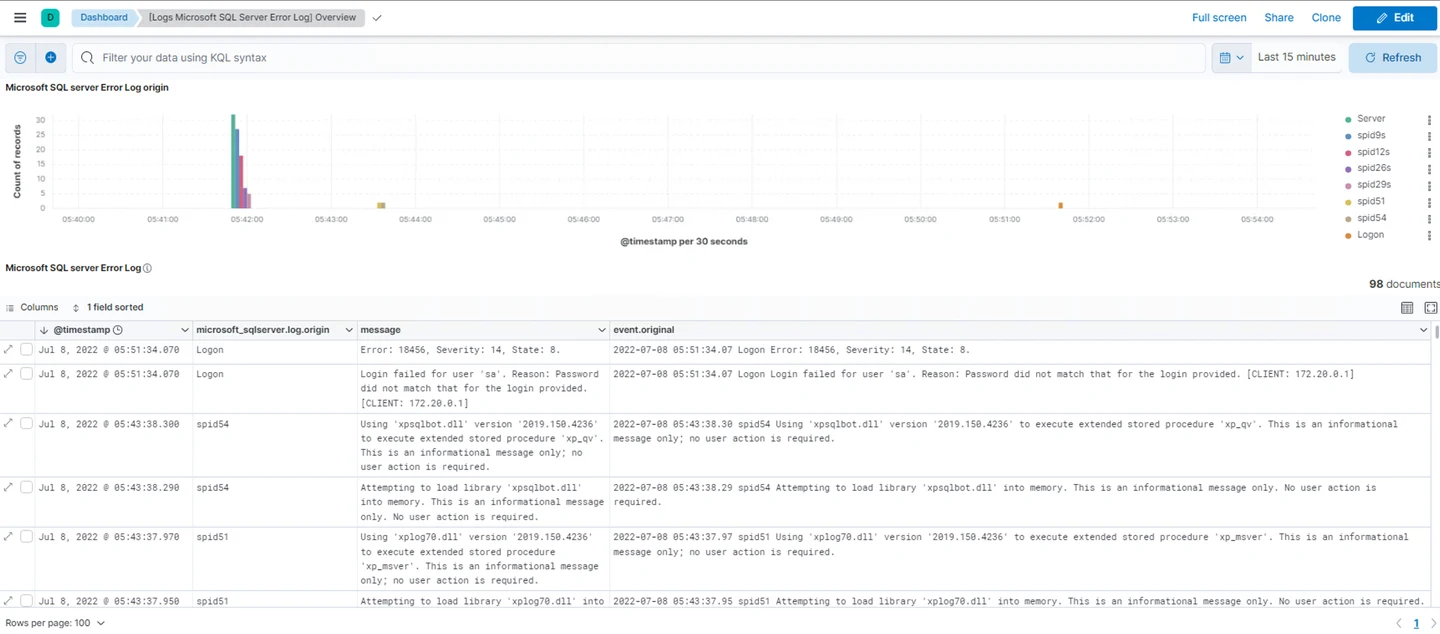
Elastic Agent’s Microsoft SQL Server integration can collect error logs into Elasticsearch for analysis. Its integration provides a starting point for structuring the entries. It fits a team that already uses Elastic to search system and application events and wants SQL Server messages available there too.
Its main value is correlating database events with other sources and building search rules from indexed fields. File rotation and permissions affect collection, especially across different host configurations. The team still owns how long log data is searchable and which events deserve an alert.
Use Elastic's SQL Server integration instructions for the correct log path and collector identity. Confirm how the event pipeline represents the message, source file and timestamp, including any multiline continuation you care about.
Compare logical events with archived and current SQL Server entries. Reproduce a collector pause and inspect any missing or duplicate records. Keep the integration version and index lifecycle configuration with the results.
- Compatibility
- Elastic Agent, Elasticsearch and a supported Microsoft SQL Server integration configuration.
- License and trial
- Elastic deployment and subscription terms depend on the selected features.
Splunk with the Microsoft SQL Server Add-on
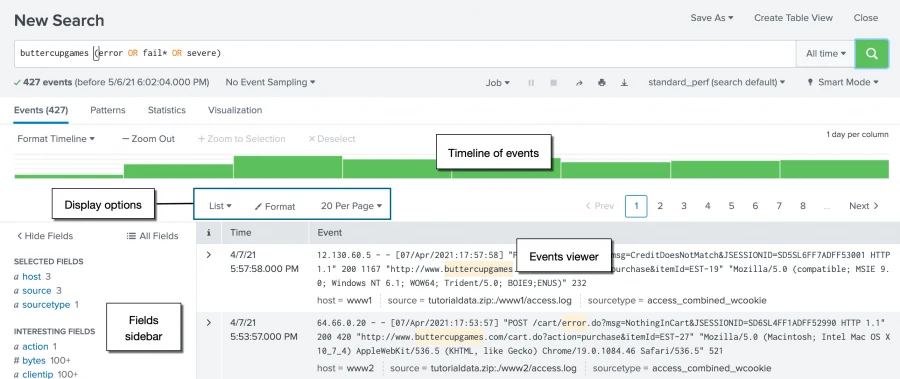
The Splunk Add-on for Microsoft SQL Server can collect error logs through file monitoring and apply the documented SQL Server source types and field extraction. That is useful for a team that wants instance errors searchable alongside Windows events and other operational signals in Splunk.
The add-on can also collect other SQL Server signals through separate mechanisms. The error log file input needs its own forwarder configuration. The chosen forwarder, access and parsing settings affect whether rotated files and multiline errors reach the index.
Pick the actual input described for the add-on and confirm whether it targets ERRORLOG, a database query or an OS event source. Check the source type and timestamp parsing on the same SQL Server log records.
Run the rotation trial with indexing and search configurations intended for production. Verify the number of events per marker and the searchable age of old records. Confirm licensing or retention assumptions for the observed volume.
- Compatibility
- Splunk deployment with the add-on and supported file monitoring or forwarding configuration.
- License and trial
- Splunk platform and data entitlements apply.
Grafana Alloy and Loki
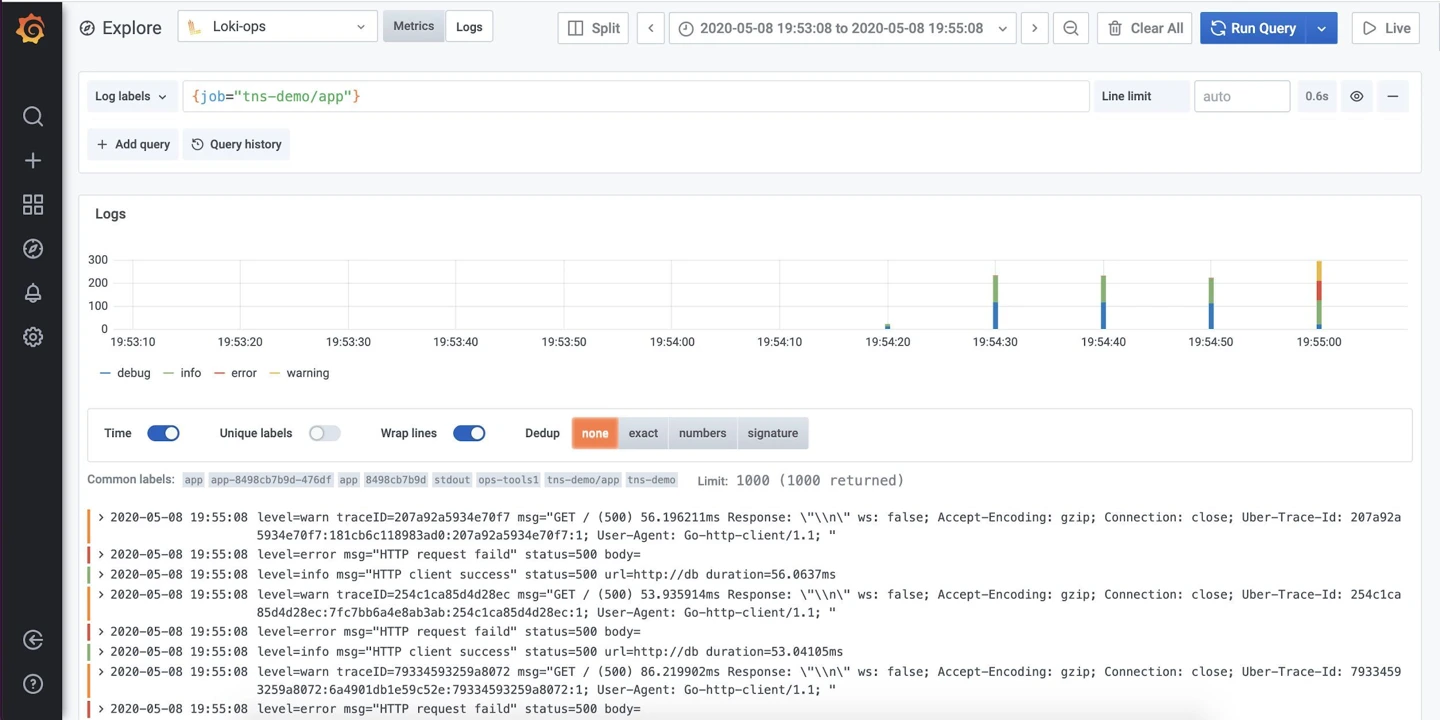
Grafana Alloy can read SQL Server log files and pass them through processing stages before sending them to Loki. This is useful when a team wants to search engine messages from Grafana and put them beside SQL Server or host dashboards. The collection and parsing rules are explicit.
It fits teams willing to maintain the pipeline and its labels. Rotation, encoding and multiline stages influence how faithfully messages are stored. A small set of stable instance and environment labels helps search without turning every unique error value into a separate stream.
Use the documented Alloy file source and configure the intended log file path, positions and Loki labels. Check how the collector identifies a recreated active file after cycling and whether a filename rule also matches archived files.
Compare marker counts and arrival after restart. Use the same LogQL query and time range for each try. Keep file identity in suitable evidence and use low-cardinality labels for routine querying.
- Compatibility
- Grafana Alloy with access to the logs, a configured Loki destination and Grafana for querying.
- License and trial
- Open-source components and commercial managed service options.
Amazon CloudWatch Logs
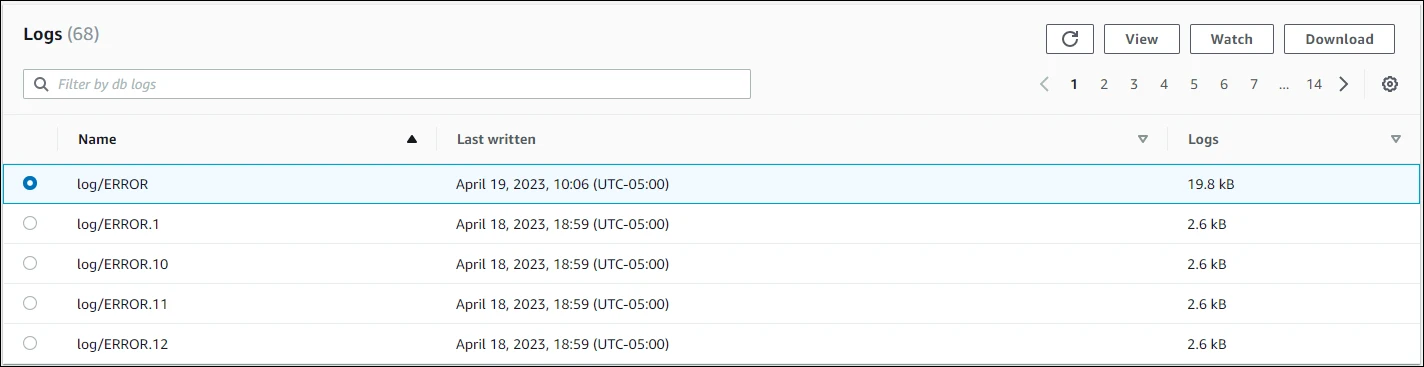
Amazon RDS for SQL Server can publish supported error and Agent logs to CloudWatch Logs. This gives a team an AWS-native way to search the messages, use metric filters and attach alarms. It is useful when the DBA cannot control a filesystem collector on the managed instance.
The workflow is strongest when log exports and retention are configured as part of the RDS deployment. Error and Agent logs can appear in separate streams, and Multi-AZ topology can add streams. Trace and dump files follow different access paths.
Use the RDS controls for publishing the supported SQL Server logs. Verify the instance version, selected export and retention of the corresponding CloudWatch log group. RDS uses managed log access and has different operator permissions from self-hosted SQL Server.
Use RDS-supported log activity to confirm delivery and time to alert. Check where events can be searched after an instance restart or rotation. Measure exported volume and set the intended retention before comparing alert cost.
- Compatibility
- Amazon RDS for SQL Server with the relevant CloudWatch Logs exports enabled.
- License and trial
- AWS ingestion, retention, query and alarm charges can apply.
Which SQL Server error log monitor fits your setup?
| What you need | Tools to shortlist | What to verify |
|---|---|---|
| Page the DBA for an engine error in a SQL Server console | Check whether the rule matches the error number, severity or message text, and how it behaves when the same message repeats. | |
| Search SQL Server logs across hosts and applications | Verify file encoding, event boundaries, log rotation and labels for named instances sharing a host. | |
| Collect Database Engine errors from Amazon RDS | Enable the RDS error log export. Verify the expected log group, permissions, retention and a notification from a known event. |
Choose where to read the SQL Server ERRORLOG
Use native log access when the operator needs an immediate look at one instance. Use file or managed-service collection when you need longer retention, searches across instances or automatic notification. On self-hosted systems identify the configured file path first. On RDS verify the supported log export.
One SQL Server with authorized native access
Start with sp_readerrorlog or the SSMS log viewer
Confirm active versus archived log and the account required.
Windows or Linux hosts expose the ERRORLOG file
Collect the file with tested rotation support
Check path, encoding, line framing, checkpoint and retention.
SQL Server runs in a managed service
Use the provider's supported export
Confirm which logs arrive and configure the alert path separately.
- Redgate alert definitions
- IDERA default alert IDs
- Quest Foglight SQL Server guide
- Datadog SQL Server integration log collection
- Elastic Microsoft SQL Server integration
- Splunk SQL Server add-on
- Grafana Alloy file source
- AWS RDS for SQL Server log access
- Microsoft sys.sp_readerrorlog
- Microsoft sys.sp_cycle_errorlog
Test the active file, archived file and collector restart
The self-hosted lab test writes an informational marker, rotates the log and writes a second marker with the same trial ID. The first message should be in archive 1. The second should be in the current log. A collector's delivery time and duplication are measured separately.
Observe clock and time zone, raw native log count and received event count. Repeat while the test collector is restarted between separate runs and check the saved position. Use a separate safe alert pattern when the product does not alert on informational entries.
| Event | Expected native location | Collector evidence |
|---|---|---|
| Before cycling | Active at the time, then archive 1 | Match the trial ID and before suffix |
| After cycling | New active ERRORLOG | Match the same ID and after suffix |
| Collector restart | Both lab markers remain in native logs until retention applies | Compare arrival, duplicates and missing entries |
| Retention check | Archived log subject to SQL Server archive settings | Central search remains available for the intended interval |
How to compare these tools
Generate a safe test error, rotate the log and verify that the alert keeps the instance, event text and time. Check which logs the collector can read without elevated access. Sources checked .
Check whether a collector misses messages during log rotation
Run only on an isolated, self-hosted SQL Server instance. Set the instance name to the lab server and change @RotateLabLog to 1. The script affects the instance error log. SQL Server restricts both rotation and logging permissions.
Write unique SQL Server ERRORLOG markers around one lab rotation
T-SQL · 19 lines
- Record current and archived log counts. Configure the test collector and identify the log paths. Use an authorized instance-level lab login and run the two-marker case.
- Search for the returned trial ID. Compare the active and archived native results with collector counts and timestamps. Verify a separate test alert only for a suitable configured pattern.
- Restart the test collector and repeat the same run with a new trial ID. Check for duplicate or missed records from both runs and the retained entries after the intended interval.
Conclusion
Choose based on what has to happen after the error. If a DBA needs a prompt alert and SQL context, trial one of the dedicated SQL Server monitors. If operations needs to search the same error alongside service logs days later, test your existing log platform's file input and retention. Use the RDS export for managed SQL Server on AWS. Keep the result from the rotation test with the alert configuration.
Frequently asked questions
What can I use to monitor the SQL Server error log?
Redgate Monitor, IDERA SQL Diagnostic Manager and Quest Foglight document SQL Server error-log alerting. Datadog, Elastic, Splunk and Grafana Alloy with Loki can collect or centralize log files. CloudWatch Logs can receive the managed error and Agent log export from Amazon RDS for SQL Server.
Where is the SQL Server ERRORLOG file?
On Windows the default is under the instance's MSSQL\LOG directory. The current file is ERRORLOG without an extension. On Linux the default directory is /var/opt/mssql/log. Check the configured location for each monitored instance.
Can I monitor SQL Server ERRORLOG from Windows Event Viewer?
The Windows Application log contains SQL Server events that the engine or service writes to it. ERRORLOG has its own entries and rotation. Use the engine error log as the source of record when a rule depends on a particular engine message.
How can I check for missed entries after SQL Server rotates its error log?
Use a disposable instance to write a unique marker before and after a controlled rotation. Compare both known entries with what the collector returns. Repeat after a collector restart to check its resume position.
Can I monitor error logs on Amazon RDS for SQL Server?
Yes. Enable the RDS error log export to Amazon CloudWatch Logs. Agent logs are a separate export option. Set CloudWatch retention and test a known message before treating it as your alert source.
Can a collector read a SQL Server error log after rotation?
A collector can retain or read the archived message if its input and checkpoint support the rotation. Compare a unique marker in the native archive with the central search result and verify retention separately.
Related guides
- Compare tools for redacting sensitive SQL Server log data
- Compare SQL Server monitoring tools for Amazon RDS
- Compare SQL Sentry and Redgate Monitor for SQL Server incidents
- Set up SQL Server error-log monitoring and alert rules
- Look up a SQL Server Database Engine error
- Investigate SQL Server Agent job failures
- Compare general SQL Server monitoring tools