

Azure SQL Managed Instance provides familiar SQL Server features through a managed service. Its monitoring has two layers. Azure Monitor reports the resource’s CPU, storage and service health. A database connection can provide query, wait and session evidence. The two layers can point to different causes for the same report of slow performance.
Azure Monitor is a starting point for platform alerts and resource limits. Products such as Redgate Monitor, DPA and Foglight can add a DBA’s view of workload history. A collector still needs network access to the instance and the permissions for the data it reads. The choice is which product can follow an alert down to the evidence the team needs.
Azure SQL Managed Instance monitoring tools at a glance
Check whether each product is collecting from the Azure resource, the SQL Server endpoint or both. Confirm support for Managed Instance specifically.
| Tool | Data route | What to investigate | Setup or entitlement |
|---|---|---|---|
| Azure Monitor | Azure Monitor metrics, logs and configured diagnostic settings | CPU or capacity, Azure alerts and related resource events | Azure resource role, diagnostic settings and log or alert processing costs |
| Redgate Monitor | Documented Managed Instance SQL registration and applicable Azure data | Supported SQL Server queries, metrics and alert investigations | Check private network, Azure integration, SQL role and license |
| SolarWinds DPA | Managed Instance-specific SQL endpoint and collector registration | Wait-oriented SQL evidence and historical metrics | Verify network, account scope, database versions and licensing |
| IDERA SQL Diagnostic Manager | Supported Azure SQL monitoring in the chosen edition | Confirm Managed Instance features independently from Azure SQL Database | Check applicable version, SQL grants and resource visibility |
| Quest Foglight for SQL Server | Configured SQL Server cartridge with Managed Instance where documented | Database or query evidence in the applicable collection mode | Verify engine scope, agent access, diagnostics and billing |
| Datadog Database Monitoring | Azure integration and a separately configured SQL Agent where supported | RDS-independent Azure resource and SQL query evidence | Azure resource and SQL query evidence |
| dbWatch Control Center | Supported Managed Instance SQL monitoring path | Fleet inventory, scheduled metrics and SQL evidence | Check deployment role, network, monitoring functions and terms |
| ManageEngine Applications Manager | Managed Instance resource setup with separately scoped SQL evidence | Azure instance metrics and collection status | Check Azure access, monitor count and actual SQL coverage |
Azure Monitor
Azure Monitor collects Azure SQL Managed Instance platform metrics and can route alerts based on resource conditions. Metrics include service-level measures of CPU, storage and I/O. This is useful when an operations team needs to detect an approaching tier limit or see whether an Azure resource changed state.
The strength is the platform’s own view of the managed instance. A threshold can show resource pressure, while a query investigation still needs database-level activity or logs. Metric availability, diagnostic settings and the configured retention determine what the team can review later.
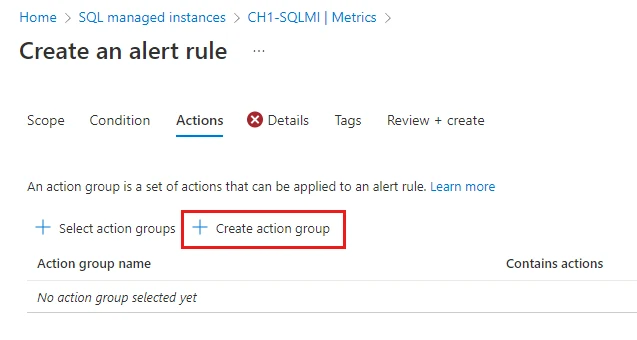
Start with the Managed Instance resource ID, metric dimension and Azure alert rule. Compare CPU and storage values at the scope where the alert runs. Verify dashboard and Log Analytics retention separately.
Compare the alert interval with a SQL-side sample. Azure Monitor answers which resource crossed a threshold. Query Store or a SQL-aware collector helps identify database queries and waits. Record which claims depend on diagnostic export.
- Compatibility
- Azure subscription and supported Azure SQL Managed Instance resource metrics or diagnostic settings.
- License and trial
- Azure Monitor and destination charges depend on collection, retention and alerts.
Redgate Monitor
Redgate Monitor can connect to Azure SQL Managed Instance and present supported query, instance and resource information in its monitoring interface. It is useful when one team supports managed instances and regular SQL Server installations and wants the same process for investigating alerts.
Its advantage is keeping SQL Server investigation close to Azure resource evidence where enabled. Instance connectivity and Azure metrics have separate requirements, and the feature matrix differs from a self-managed Windows host. The network path, database rights and Azure access all affect what it can collect.
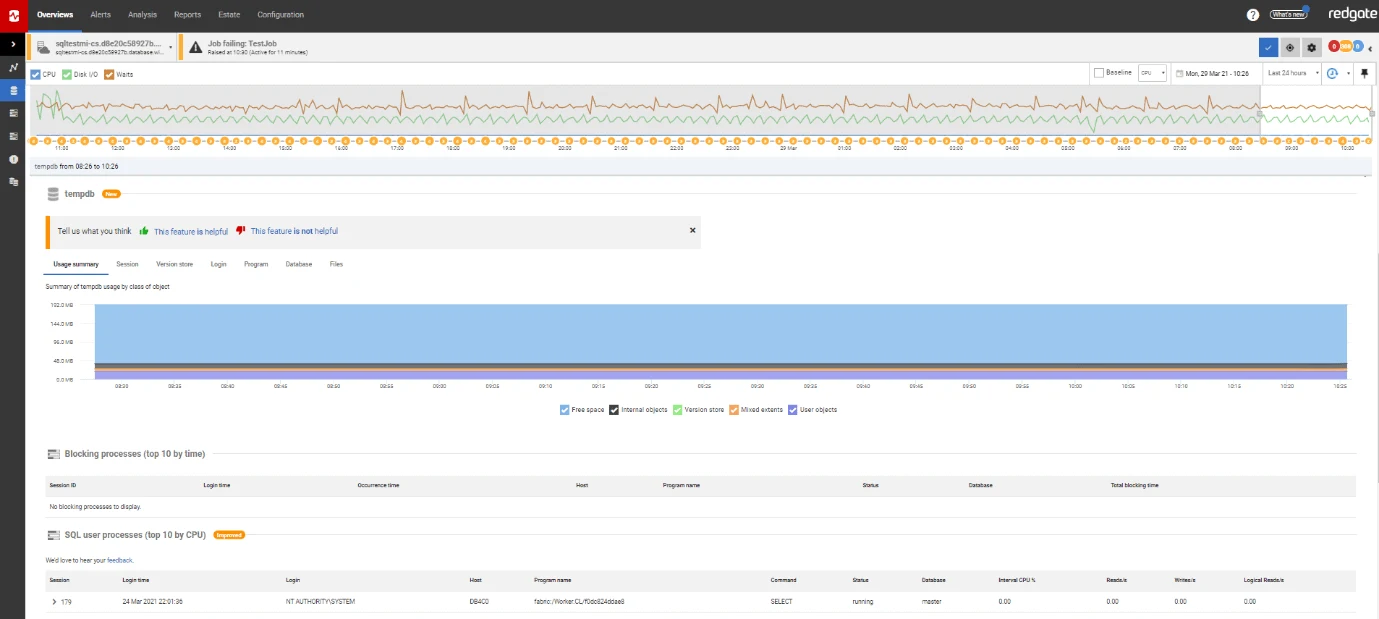
Follow the dedicated Managed Instance guide and verify that the monitoring service can reach the selected endpoint. Check the SQL grants independently from any Azure identity used to collect platform metrics.
Test a real lab alert and find query or wait information in the same interval. Compare exact unsupported fields or gaps with the requirements. Capture how the installed edition counts a Managed Instance target.
- Compatibility
- Redgate Monitor with access to the Managed Instance endpoint and any required Azure integration.
- License and trial
- Commercial monitoring license.
SolarWinds Database Performance Analyzer
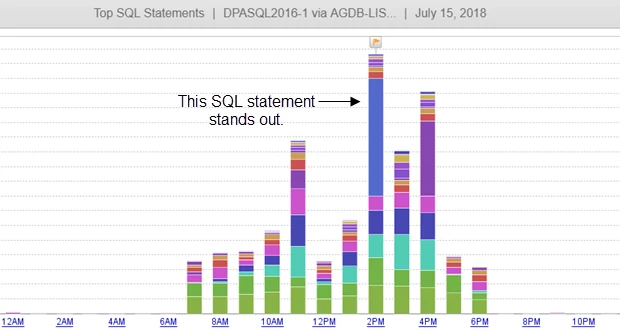
SolarWinds Database Performance Analyzer can register Azure SQL Managed Instance and collect query and wait information from it. That is useful when a DBA needs to find which statements or wait types account for a period of poor database response time.
Its main fit is query-level monitoring across different database platforms. DPA still needs a valid route and credentials for the managed instance and its own monitoring repository. Its view of resource delay can complement Azure Monitor metrics when the constraint is outside the database connection.
Register the managed instance using the specific target instructions. Check network placement and the monitoring identity before comparing uptime or waits. Separate a managed instance from a single Azure SQL Database target.
Choose a test period with known activity and compare historical wait evidence with the native database readout. Save the query metadata, interval and instance identity needed to repeat the diagnosis.
- Compatibility
- DPA with a supported Managed Instance endpoint and database monitoring permissions.
- License and trial
- Commercial SolarWinds licensing.
IDERA SQL Diagnostic Manager
IDERA SQL Diagnostic Manager supports monitoring in SQL Server environments that include Azure SQL Managed Instance. Its SQL Server console is useful when a DBA wants to bring the managed target into an established workflow for sessions, alerts and instance diagnostics.
Its useful coverage depends on the version and Managed Instance support in the deployment. Some checks designed for full host access have different inputs or coverage on the managed service. Azure metrics remain relevant when the problem concerns resource limits or service health.
Check the IDERA support matrix and Azure configuration against the exact managed instance deployment. A product reference for Azure SQL Database does not establish the same monitored functions for Managed Instance.
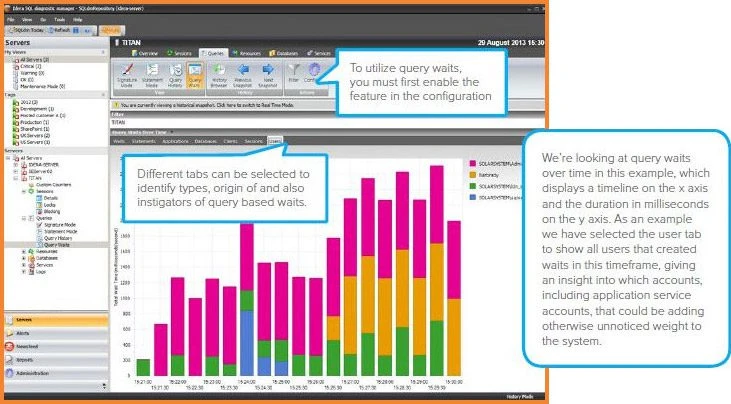
Compare the selected collection path with Azure metrics and a known SQL query window. Confirm whether waits and alerts are captured and who can review them. Record what the chosen license covers.
- Compatibility
- SQL Diagnostic Manager release and configuration supporting Azure SQL Managed Instance.
- License and trial
- Commercial IDERA monitoring license.
Quest Foglight for SQL Server
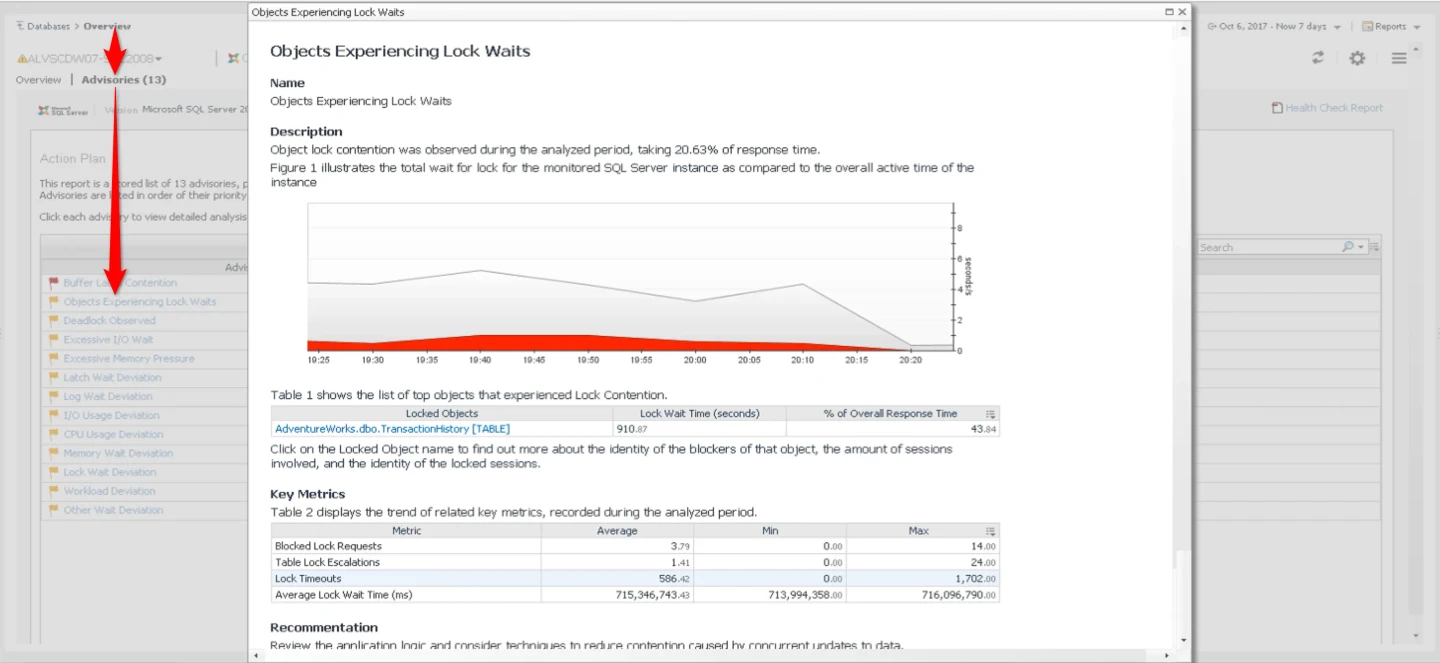
Foglight can add an Azure SQL Managed Instance as a monitored SQL Server target through its documented agent workflow. This is useful for teams already using Foglight to examine query and instance activity across SQL Server and other database platforms.
The benefit is a common monitoring process around the managed endpoint. Query and wait evidence depends on the cartridge, SQL PI configuration and granted permissions, and available network routes matter for a privately exposed instance. Platform changes and resource limits can require separate Azure data.
Select the correct Foglight cartridge and confirm Managed Instance support for the engine and deployment. Check how monitoring accounts and network connectivity are configured for each data source.
Try the same CPU interval and known SQL query in the applicable dashboard or SQL PI view. Check which data remains available after the trial. Include the installed product and cartridge versions with the result.
- Compatibility
- Supported Foglight deployment and SQL Server agent with access to the Managed Instance endpoint.
- License and trial
- Commercial Quest monitoring product and applicable feature terms.
Datadog Database Monitoring
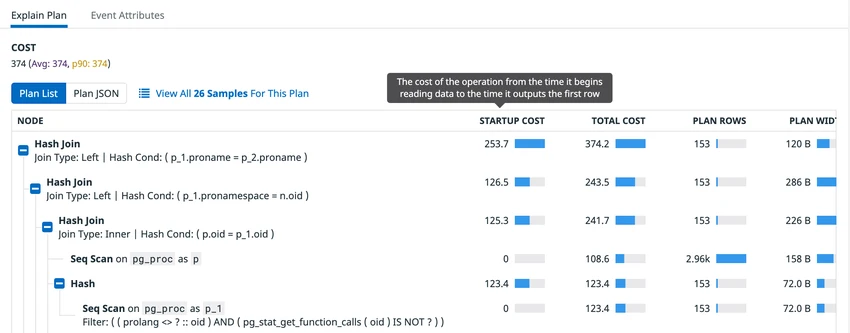
Datadog Database Monitoring provides a configuration for Azure SQL Managed Instance using an Agent on a separate reachable host. It can collect database query and activity data alongside other Datadog signals. This is useful when the application team already starts investigations from Datadog traces or dashboards.
The setup separates the SQL connection from any collection of Azure resource metrics. The Agent needs a network route and an account with the documented permissions, and query detail depends on collection settings. Short-lived statements or sensitive context can affect what the monitoring workflow retains.
Use the Azure SQL Server setup for the actual Managed Instance variant and verify the collector can reach SQL Server. The Azure integration and SQL Server Agent connection can fail independently. Record how both credentials are configured.
Compare Azure metrics, query samples and any plan evidence in the expected database and time window. Verify the chosen monitor, sampling and retention. Include any additional Azure and hosted charges in the comparison.
- Compatibility
- Datadog Agent with Managed Instance access and supported SQL Server monitoring authentication.
- License and trial
- Commercial Database Monitoring and applicable Azure or Datadog integration terms.
dbWatch Control Center
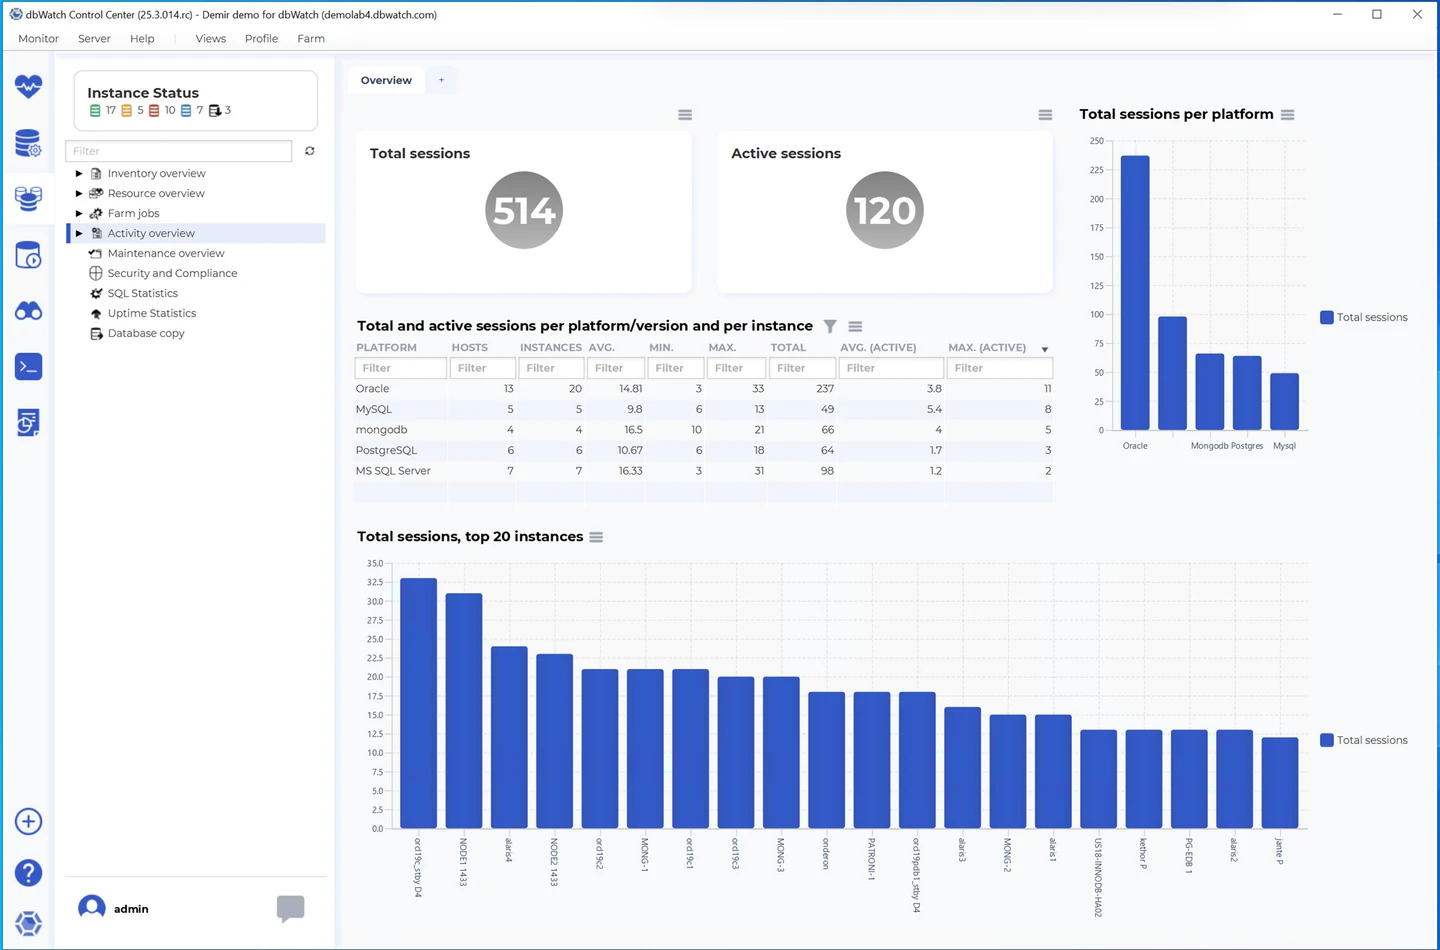
dbWatch Control Center supports Managed Instance through compatible SQL Server jobs and estate views. This is relevant when a DBA already uses dbWatch to schedule collection and observe many database installations. The same inventory can show selected engine metrics across different SQL Server deployment types.
Its usefulness depends on the jobs available for Managed Instance. A custom job can only inspect the settings and history the service exposes to the account. It works best when the team verifies which existing estate checks carry over and which need Azure-side collection.
Use the documented platforms list to confirm the supported target. Check whether the chosen collector is in a network that reaches the instance and whether its SQL roles cover the desired databases.
Try a fleet view and a resource alert, then independently verify the SQL activity available in the expected interval. Record scheduled jobs and version dependencies with the view and retained measurements.
- Compatibility
- dbWatch with a supported Managed Instance connection and compatible jobs.
- License and trial
- Commercial dbWatch licensing.
ManageEngine Applications Manager
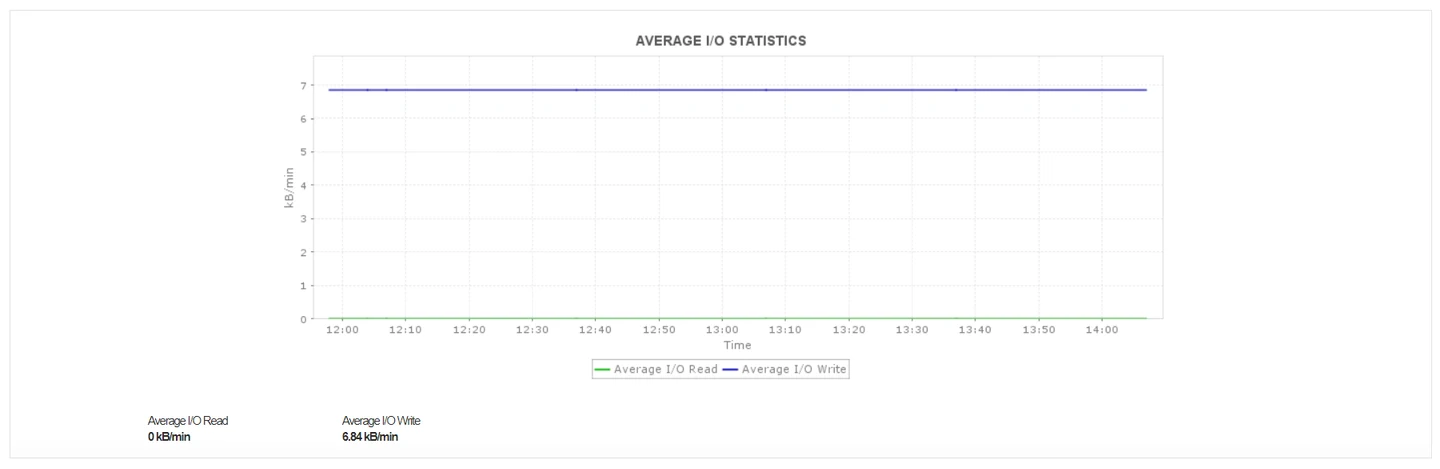
ManageEngine Applications Manager has a dedicated Azure SQL Managed Instance monitor for service metrics and availability. That is useful when an operations team wants Azure resource alerts beside other application and infrastructure monitoring. It can centralize routine checks without exposing the host itself.
The product is strongest when the monitored conditions match its Azure metrics and resource access. Diagnosing a particular query is a separate database monitoring task. Permissions and the enabled monitor determine whether the operator can move from a resource alert to the SQL activity behind it.
Register the Managed Instance resource using the documented monitoring setup. Confirm the collected Azure metrics under the right identity. Check any extra engine monitoring separately under a SQL login.
Use the same metric and UTC interval to compare the service chart with the SQL diagnosis. Verify what the product can collect on the selected plan, then check alert delivery and retention.
- Compatibility
- Applications Manager with the applicable Azure credentials and Managed Instance monitor.
- License and trial
- Commercial plan and any applicable Azure telemetry charges.
Match the monitor to the Azure SQL Managed Instance job
| What you need | Tools to shortlist | What to verify |
|---|---|---|
| Set resource alerts and track the instance against its configured limits | Compare CPU and storage with the correct Azure resource ID and time window. Verify alert delivery and alert history. | |
| Investigate SQL waits, blocking and query performance | Connect through the approved network and verify that the tool retains useful query detail after the test incident ends. | |
| Add Managed Instance to an existing SQL Server monitoring estate | Check each vendor's MI feature list, the SQL grants and which existing alerts can be reused. |
Select the right Azure SQL Managed Instance monitoring layer
An Azure resource monitor can work while the SQL collector fails because they use different access paths. Record the Azure role scope and the private network or SQL identity needed for query diagnostics.
Service resource metrics or an Azure alarm
Start with Azure Monitor
Check resource ID, metrics aggregation, action group and log settings.
Query or wait history inside the managed instance
Use Query Store or a documented MI collector
Confirm SQL privileges, eligible database and retention.
You are replacing an existing database watcher
Verify migration and feature scope
Check Microsoft's dates and whether Fabric Database Hub exposes both inventory and performance for your resource.
- Microsoft Azure Monitor for Managed Instance
- Redgate Managed Instance configuration
- DPA registration for Managed Instance
- IDERA Azure SQL monitoring options
- Quest Foglight compatibility notes
- Datadog Azure SQL Server setup
- dbWatch supported platforms
- ManageEngine Managed Instance monitoring
- Microsoft database watcher retirement and dates
- Microsoft Fabric Database Hub support by service
- Microsoft SQL Server Query Store
Follow a resource alert to the SQL query evidence
Use the same UTC window in Azure Monitor and your query or wait collection. Record the managed instance resource ID and database separately. Query Store is scoped to a database. Resource CPU crosses the instance scope.
Microsoft stopped new watcher creation and edits on November 9, 2026 and lists April 30, 2027 as the date existing watchers stop collecting. The current Fabric Database Hub documentation lists Managed Instance in Estate. It distinguishes services that have Performance-page support. Check that distinction before planning a replacement.
| Milestone | Azure access | SQL Server access | Evidence |
|---|---|---|---|
| Resource alert | Read monitoring data and alert for the resource | None for the Azure view | UTC, metric window, threshold and resource ID |
| Connection concern | Check Azure resource or network status where authorized | Verify private endpoint route and intended login | SQL identity, endpoint and actual failure |
| Database workload | Use related resource chart as context | Read appropriate Query Store or wait details | Query ID, database and overlapping interval |
| Retention check | Verify Azure diagnostic and alert history | Verify collector or Query Store history | Which alert and query facts remain connected |
How to compare these tools
Test an instance resource threshold and a blocking event. Check which metrics and query details the product collects, how it authenticates, and where alerts are routed. Sources checked .
- Microsoft Azure SQL Managed Instance resource metrics and logs
- Microsoft database watcher retirement timeline
- Microsoft Fabric Database Hub supported Performance targets
- Microsoft Azure SQL Managed Instance DMV guidance
- Microsoft Query Store settings and permissions
- Microsoft Azure SQL Managed Instance alert setup
Test an Azure resource alert and the SQL investigation together
Use an approved disposable Managed Instance database. Record a known lab workload and match it to a controlled alert or recorded resource event. Run the read-only probe from the actual SQL monitoring network.
Match an Azure Managed Instance observer to a UTC alert window
T-SQL · 21 lines
- Record the Azure resource ID, alert interval and effective Azure permissions. Record SQL database context and SQL permissions independently from the probe host.
- Compare a known query in Query Store or your collector with the Azure resource chart. Use UTC in both views and record any sampling gap.
- Reopen the incident after the lab activity ends and compare retention. Repeat the connection with the intended private-network path or credential to verify exactly what each layer can still see.
Conclusion
Keep an Azure Monitor resource view for Managed Instance. Add a query collector when the on-call DBA needs help finding what changed in a database. Use the same UTC window to show the connection between the resource alert and the SQL activity. Verify access and retention before relying on the tool in an incident.
Frequently asked questions
Can Azure Monitor monitor SQL Managed Instance?
Yes. Azure Monitor provides Managed Instance resource metrics, logs and alert rules. For query history, use Query Store in each database or choose a collector that supports Managed Instance.
Can I use Query Store for Azure SQL Managed Instance monitoring?
Yes. Query Store records query text, plans and runtime statistics for the selected database when enabled and configured to capture the activity. Check its actual state and aggregation interval before using it for incident history.
Why can Azure resource charts work while a SQL monitor stops collecting?
Azure resource metrics use the Azure service and resource permissions. A SQL collector needs network access to the instance and appropriate SQL-level permissions. Check its connection, credential or managed identity, and last successful collection.
What replaces database watcher for Azure SQL Managed Instance?
Microsoft stopped new database watcher creation and edits on November 9, 2026. Existing watchers stop collecting on April 30, 2027. Fabric Database Hub currently shows Managed Instance in Estate. Use Azure Monitor for resource alerts and Query Store or an MI-aware collector for SQL history while Fabric adds support. Review retained data and test replacement alerts before your watcher stops.
Can an Azure SQL Database monitoring tool also monitor Managed Instance?
Check the vendor's Managed Instance support separately. Its connection setup, permissions, licensing and features can differ between Azure SQL Database and Managed Instance.
Can an Azure Managed Instance resource alert identify the SQL query that caused it?
The resource alert records a metric at the configured scope. Compare the time window with Query Store or the SQL collector to find query and wait evidence. Treat the association as a hypothesis until the workload confirms it.