

A SQL Server connectivity check can test whether a TCP port answers, whether a SQL login succeeds or whether a query runs in the intended database. Those checks cover different failure points. An open port shows that a network path can reach a listener. Only a database session tests authentication, encryption settings and the account’s access to that database.
The probe location matters as much as the tool. A check inside a private network can succeed while an application subnet or remote office still cannot reach the instance. TCP sensors are useful for locating a network issue. An authenticated query adds the evidence needed when users can connect to the host but the application still reports a database failure.
SQL Server connectivity check tools at a glance
Choose the earliest useful failure signal and a database-level confirmation. Run both from the application network when path-dependent failures matter.
| Tool | Probe depth | Evidence to verify | Deployment or licensing |
|---|---|---|---|
| PRTG Microsoft SQL v2 | SQL Server connection and an applicable sensor query | Check credential, query result, timeout and result channel | Commercial. Choose a probe on the intended network. |
| Telegraf SQL input | SQL driver connection and configured result query | Verify target database, output and error visibility | Open-source agent with a supported driver and authorized login |
| Datadog TCP check | Connection to a TCP host and port | Shows socket-level availability from the Agent | Commercial platform. Combine with SQL evidence as needed. |
| Grafana Synthetic Monitoring | Supported network-check type from selected probes | Verify the TCP endpoint and whether a private probe is required | Hosted plan or configured private probes |
| Prometheus Blackbox Exporter | TCP connection, plus documented probe module features | Match endpoint and timeout. Scope result to the configured module. | Self-managed exporter using approved probe configuration |
| Checkmk active checks | TCP service check and separately configured SQL-capable checks | Read the actual service command and check output | Check edition, plugins and monitoring site or agent placement |
| Microsoft sqlcmd | SQL Server login, database selection and executed query | Set connection and query timeouts. Check exit and returned value. | Microsoft tool. Match driver variant and TLS settings. |
| dbatools Test-DbaConnection | SQL Server connectivity diagnostic workflow | Run from the same host with the intended credential and endpoint | Open-source PowerShell module. Verify options and runtime. |
Paessler PRTG Microsoft SQL v2 Sensor
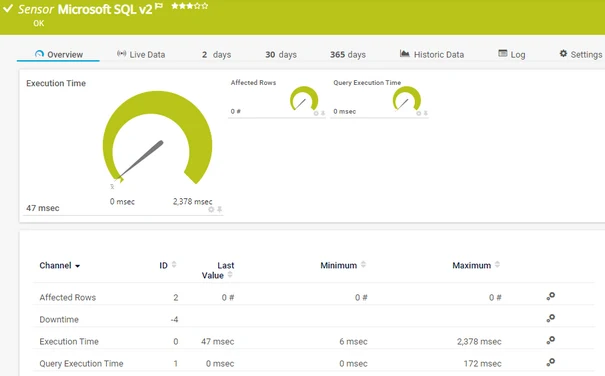
PRTG Microsoft SQL v2 Sensor can connect to SQL Server and execute a configured query. It measures aspects of the database connection and query workflow and can evaluate selected returned values. That is useful when the team already runs PRTG probes and wants to check the SQL path along with the network path.
The value is having the monitor check something closer to what the application does. PRTG must run from a representative probe and use a driver, account and target database that match the test. A connection and query sensor has a different cost and meaning from a simple port check.
Use the documented SQL Server sensor with the intended database and a low-impact check. Verify query outcome and connection errors separately. Configure the remote probe close to the workload path so it sees the same firewall and routing.
Test one incorrect port and one SQL error in separate lab checks. Review state and timing from the same evaluation window. Check which details are retained and how the chosen sensor counts toward licensing.
- Compatibility
- PRTG probe with a supported SQL Server driver, target and SQL credentials.
- License and trial
- Commercial PRTG licensing depends on sensor and deployment terms.
InfluxData Telegraf
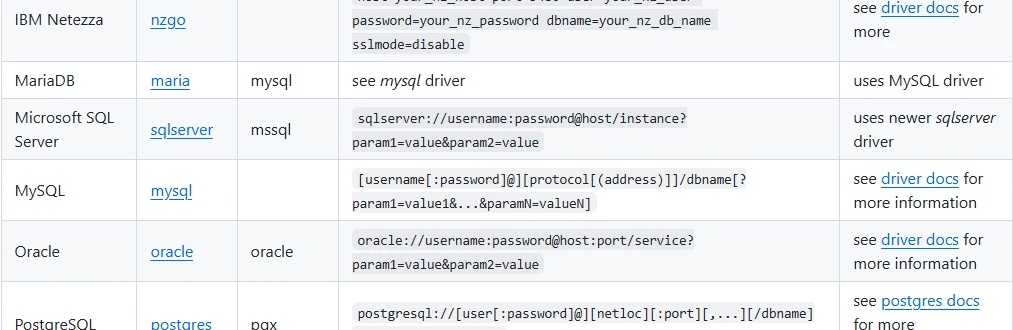
Telegraf’s generic SQL input can execute selected SQL statements through a configured driver and publish returned values as metrics. A small SQL Server query can verify the database path from a collector and expose an application-specific result if needed. It fits teams that already operate a metrics pipeline.
The collector and query are explicitly defined, which makes the test repeatable. Pooling, timeout and reconnect behavior influence what a failure means. The connection settings need to test the same encryption and database context the application actually uses.
Use the documented SQL input driver and the exact SQL Server destination. Keep credentials and TLS settings with the deployed agent configuration. Define a narrow query that exposes the expected result rather than a privileged server-wide metric.
Inspect agent logs and metrics when the connection succeeds but the query fails. Make sure alerting can distinguish no new samples from a valid result. Verify the agent host and query budget.
- Compatibility
- Telegraf with a supported SQL Server driver configuration and a metrics destination.
- License and trial
- Open-source collector. Managed storage and alerting can have separate terms.
Datadog Agent TCP Check
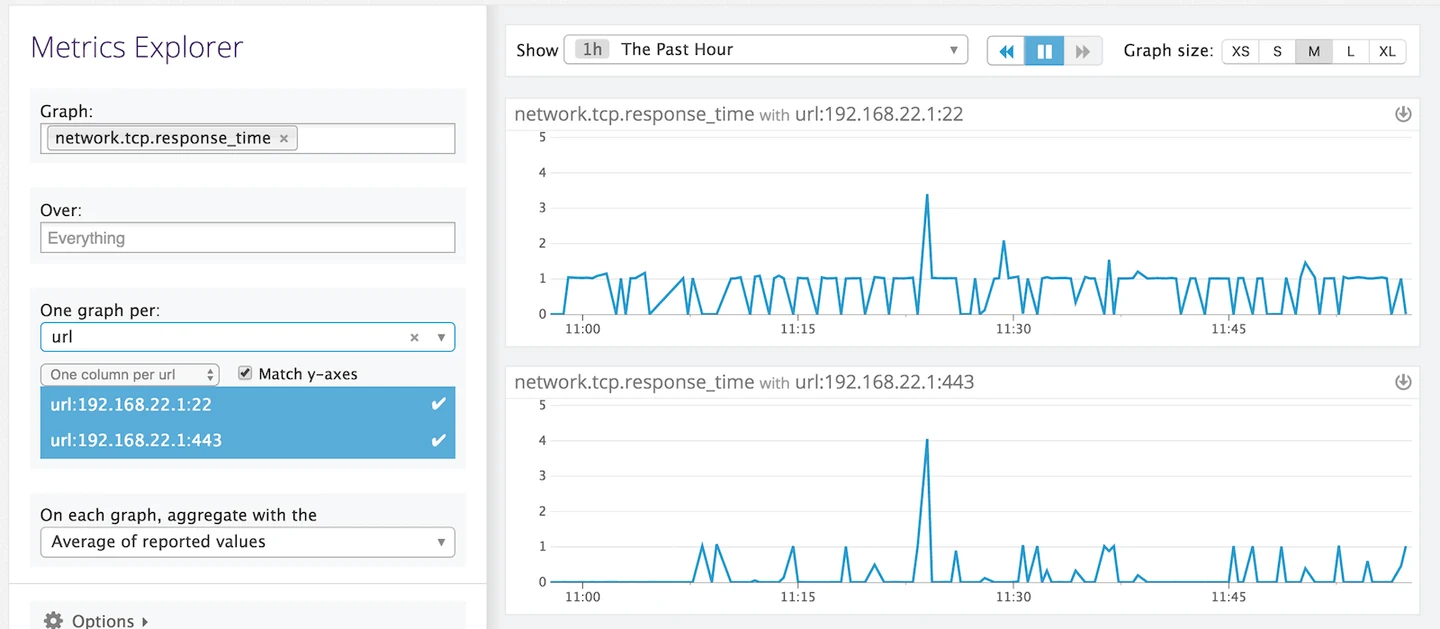
The Datadog Agent TCP check tests whether a configured host and port accept a connection and can report response time. That is useful for verifying reachability from an Agent near the application or on another network segment without needing database credentials.
It fits network checks and endpoint availability alerts. A successful TCP check leaves authentication, certificate validation at the database client and database access untested. A separate SQL check gives the additional evidence needed for an application login or query failure.
Point the TCP check at the actual SQL Server endpoint and port from the intended Agent network. An open socket provides an early signal for reachability. Compare it with a separate SQL query failure in the same period.
Test the interruption from a private probe location or monitored host that matches the application route. Record TCP and database-check results separately, so a healthy probe does not conceal a refused login.
- Compatibility
- Datadog Agent with network access to the SQL Server endpoint.
- License and trial
- Datadog monitoring and Agent deployment terms apply.
Grafana Cloud Synthetic Monitoring
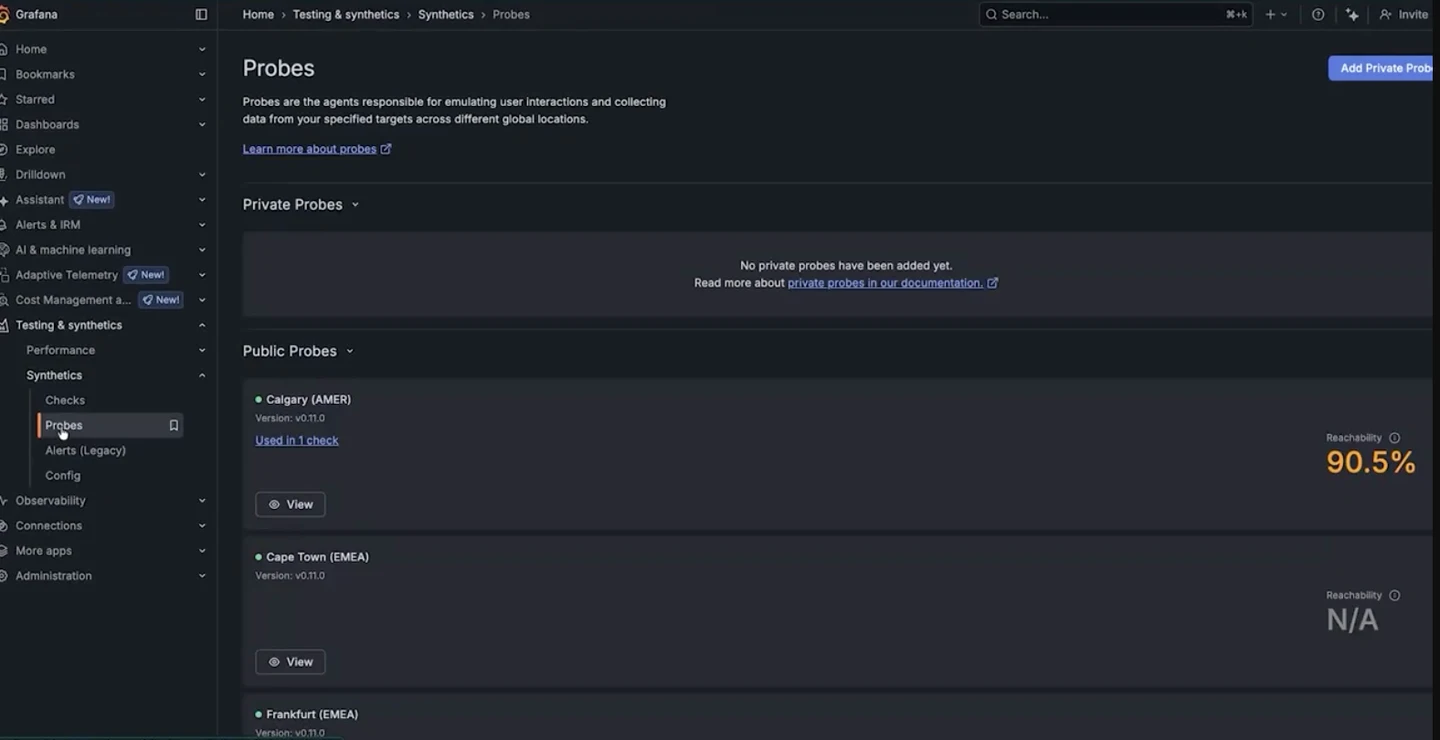
Grafana Cloud Synthetic Monitoring offers TCP checks from managed or private probes. A private probe can test SQL Server reachability from inside the network where an application runs. This is useful when the team needs to compare paths or record outages from selected locations.
Its strength is consistent remote observations and integration with Grafana alerting. A TCP probe measures an endpoint, while SQL authentication or query execution needs another step. Probe placement and the target address determine whether the result represents the affected customers or service.
Choose the actual Synthetic Monitoring check type and the probes that can reach the SQL address. Use a private probe when a public site has no path to the destination. Set timeout and evaluation window explicitly.
Compare the TCP result with a SQL-aware check for authentication and an expected database query. Record which probe and location produced the signal. Verify billing and alerting assumptions in the chosen setup.
- Compatibility
- Grafana Cloud Synthetic Monitoring and an eligible public or private probe.
- License and trial
- Cloud plan and probe usage terms apply.
Prometheus Blackbox Exporter
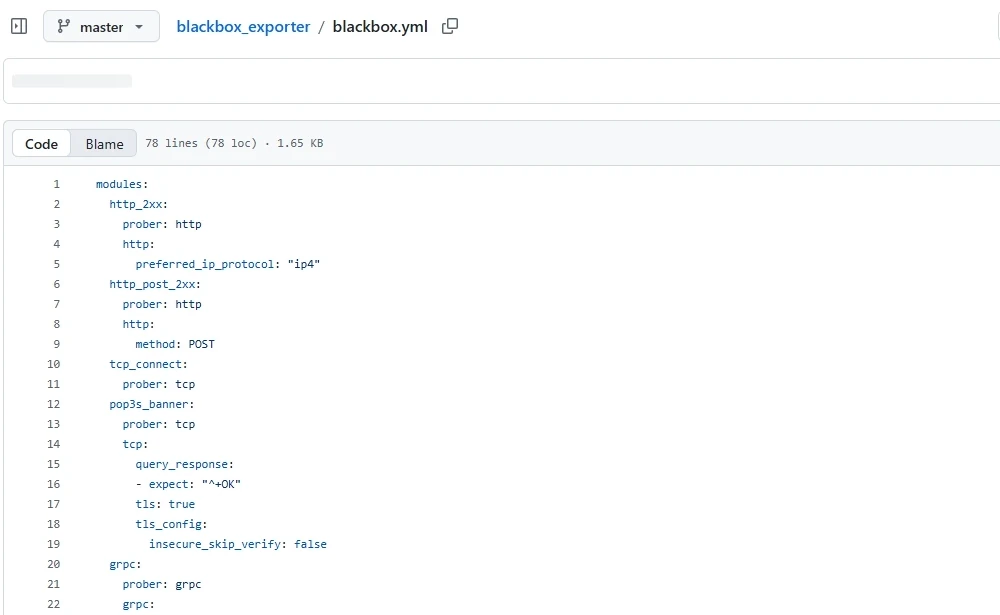
Prometheus Blackbox Exporter supports TCP probing from a deployed exporter. It exposes results that Prometheus can scrape and alert on. This fits a team that wants a small self-managed reachability check alongside other Prometheus targets.
Its benefit is control over the probe location and parameters. A TCP success tells the operator the exporter reached an open endpoint. A database login or query needs a separate check. The team owns alert thresholds and exporter availability.
Use a TCP module directed at the SQL Server port. Confirm that the exporter host can reach it and that its timeout matches the intended meaning of service availability. Interpret results according to the actual module configured.
Run a separate SQL probe when you need to verify target database or permissions. Demonstrate that the TCP monitor can remain healthy while an SQL query fails. Correlate the two signals without collapsing them into one success.
- Compatibility
- Blackbox Exporter with Prometheus scraping and network access to the target.
- License and trial
- Free, open-source components.
Checkmk
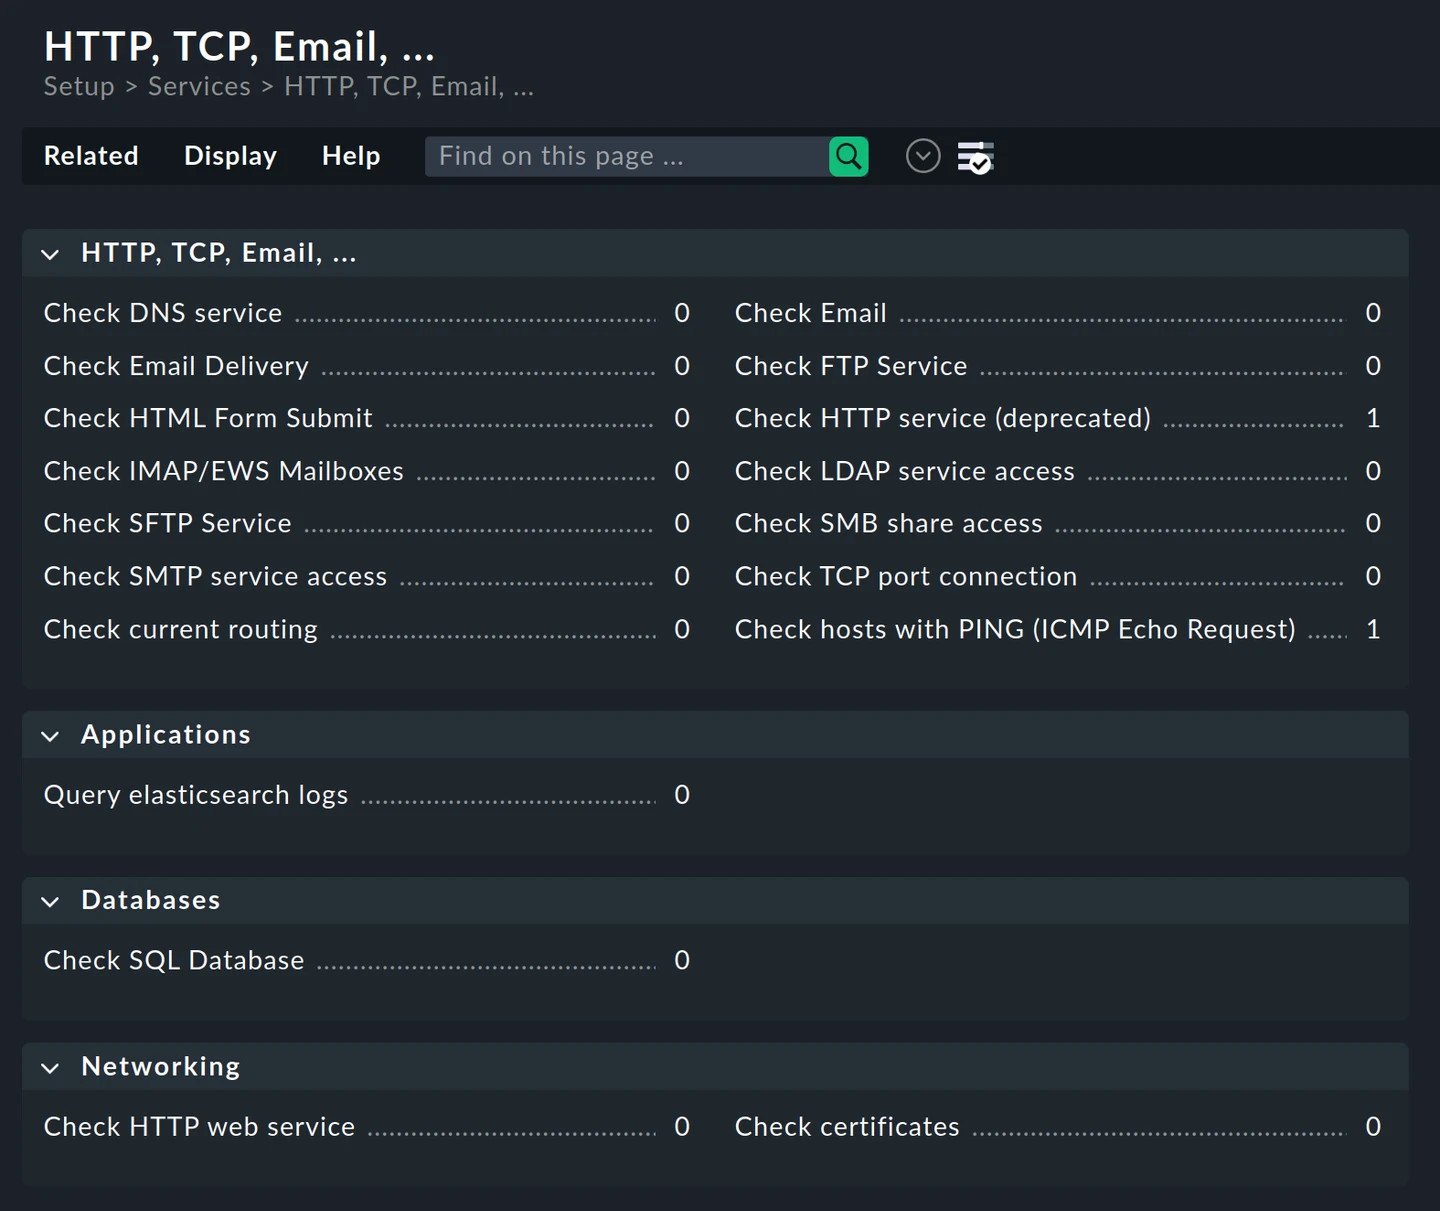
Checkmk can run an active TCP-port check and, where configured, use separate SQL Server monitoring. The port check is useful for telling an operator whether the endpoint can be reached from the monitoring site. A wider Checkmk setup can report this next to host and service status.
The distinct checks let a team isolate network and database failure modes. A remote site and the application may see different network routes. SQL-specific checks have separate credential and agent requirements, which matter if the current setup only checks the listener.
Inspect the active-check configuration and confirm which host makes the actual connection. Choose a basic TCP check when network reachability is the required signal. Verify the configured SQL check or plugin separately if login and queries are required.
Run a controlled failure with a closed lab port and one with SQL working up to login. Compare check plugin messages and which signal reaches alerting. Save the check definitions and threshold values.
- Compatibility
- Checkmk with a reachable TCP endpoint and optional SQL Server monitoring configuration.
- License and trial
- Open-source and commercial Checkmk editions.
Microsoft sqlcmd
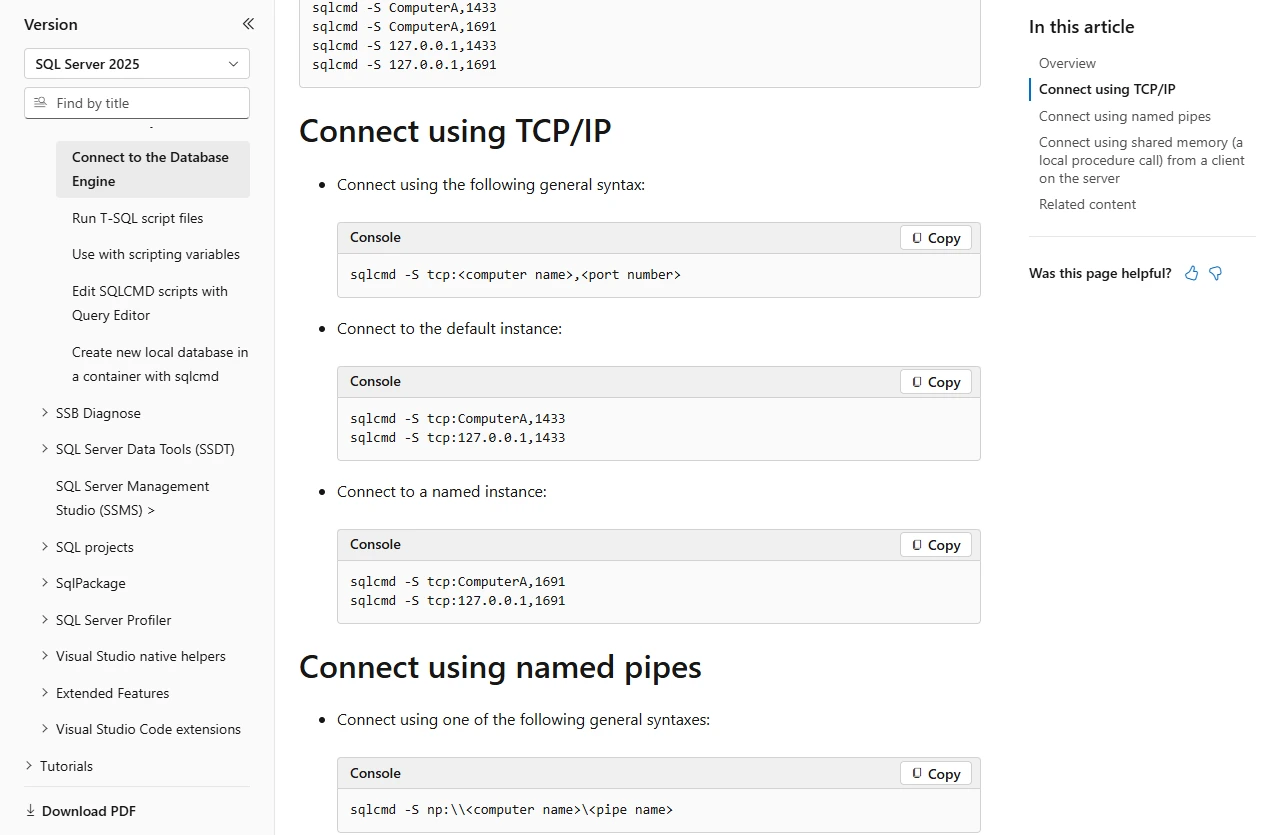
Microsoft sqlcmd can connect to SQL Server and run a short test statement in the target database. That makes it useful for proving that a specific credential, TLS setting and database context work from an application host or a CI runner. It also fits scripted verification.
It is strong for reproducing an application’s connection path explicitly. Go and ODBC versions have different options and behavior, so the invocation needs to match the intended driver and encryption mode. Batch error handling matters when the command runs as a monitoring check.
Use a TCP server name and explicit port for a test that avoids discovery ambiguity. Select the intended database and the supported driver authentication method. Keep certificate validation consistent with the configured production client.
Check the process exit status and expected SQL output. The documented -b and timeout options help detect failures. Use one probe identity restricted to the required database and query capability.
- Compatibility
- Supported sqlcmd variant with an available SQL Server connection and database credentials.
- License and trial
- Free Microsoft command-line tooling.
dbatools
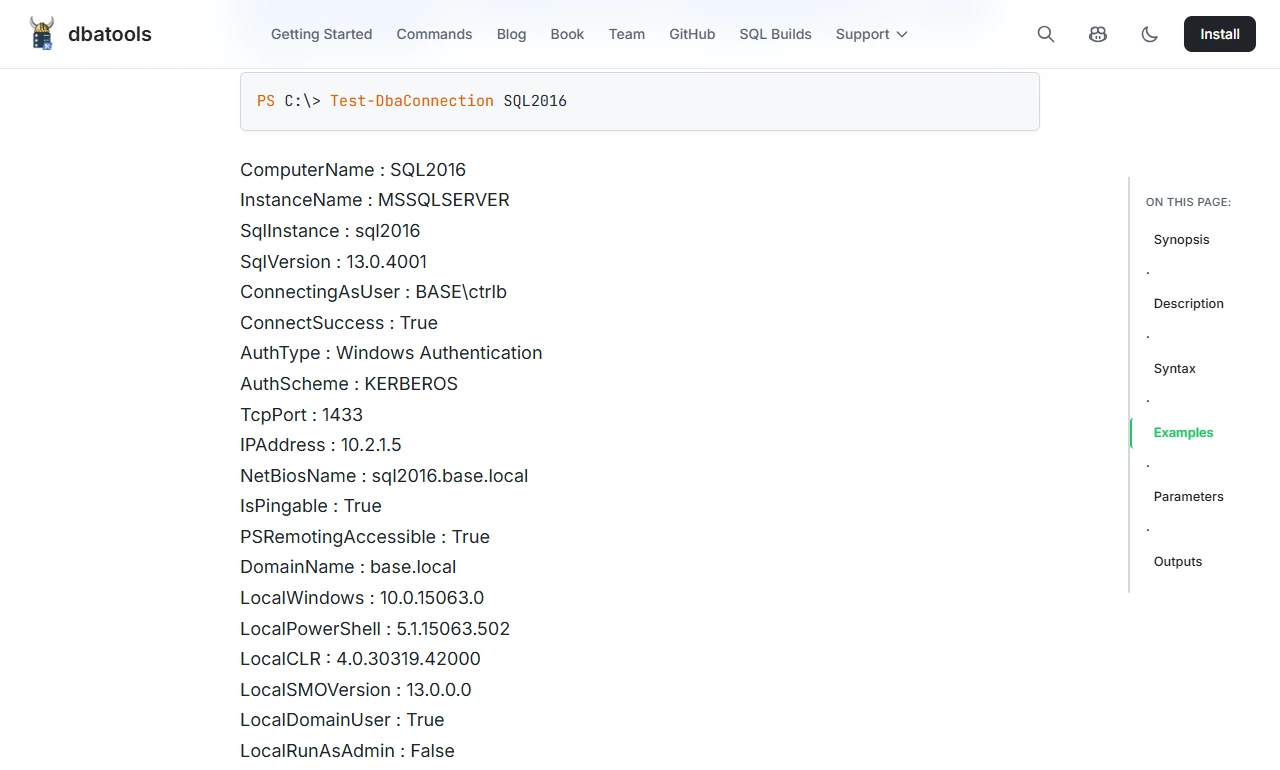
dbatools Test-DbaConnection and Invoke-DbaQuery give PowerShell operators ways to inspect SQL Server connection details or run a small query. This is useful when a DBA needs connection evidence across a list of instances or wants the result incorporated into an existing script.
The advantage is repeatability across an estate. A metadata or connection result and a query against a particular application database answer different questions. Windows authentication, certificate behavior and account context need to be assessed on the host that runs the script.
Run Test-DbaConnection with the intended instance parameters from an authorized workstation or probe host. Verify the resolved endpoint and SQL connection information. Compare the result with a known successful native SQL check.
Reproduce a known failed login and inspect what the command returns. Log the specific failure without retaining sensitive credentials. Use a separate application-level query if the success condition depends on a selected object or row.
- Compatibility
- PowerShell with dbatools and supported SQL Server connectivity.
- License and trial
- Free, open-source module.
What do you need the connectivity check to verify?
| What you need | Tools to shortlist | What to verify |
|---|---|---|
| Run a SQL query from a scheduled probe | Use the expected database and a numeric result so an alert can distinguish a wrong result from a missing one. | |
| Detect transport failures from a remote segment | Record the probe location, the DNS target and exact port in the alert. Use a SQL-aware check for login and query coverage. | |
| Test the connection from the machine with the issue | Use the supported client version, the same listener or host name and the authentication method the application uses. |
Match the probe to the stage of connection
A named instance can use a dynamic port. SQL Server Browser can help clients discover it through UDP 1434 when applicable. A known TCP port removes that dependency from the probe. Preserve certificate and name validation when testing the SQL protocol.
DNS, routing or the server port
Use a network probe from the application's route
Check address, port, timeout and probe placement.
TLS and database sign-in
Use the same SQL driver path and credential type
Check certificate trust, login and the selected database.
An application query must return a known result
Execute one bounded SQL query
Check the intended database, result and process status.
- PRTG Microsoft SQL v2 sensor
- Telegraf SQL input plugin
- Datadog TCP check
- Grafana Synthetic Monitoring check types
- Prometheus Blackbox Exporter
- Checkmk active service checks
- Microsoft sqlcmd connection examples
- dbatools Test-DbaConnection
- Microsoft SQL Server Browser and named instances
- Microsoft SQL client connection and encryption settings
Test a closed port, refused login and failing SQL query
Run each failure independently on a disposable target from the same probe. A closed port prevents the SQL handshake. A login refusal occurs after reaching SQL Server. A query error can occur with both the network and login healthy.
Use a known working certificate and DNS name for the login test. Use a restricted test identity and an intentional query error rather than modifying permissions in a shared environment. A separate certificate mismatch case can verify TLS-specific reporting.
| Fault | TCP check | SQL-aware check |
|---|---|---|
| Closed lab port | Fails or times out | Connection fails before sign-in |
| Unknown lab login on working endpoint | Succeeds | Authentication is rejected |
| Expected SQL error while connected | Succeeds | Query fails despite an established connection |
| Valid authorized probe | Succeeds | Reports ConnectivityTrial and value 1 |
# Supply SQLCMDPASSWORD securely for this dedicated SQL login.
sqlcmd -S 'tcp:lab-sql.example.test,1433' -d 'ConnectivityTrial' \
  -U 'sql_probe' -l 5 -t 5 -b \
-Q "SET NOCOUNT ON; SELECT DB_NAME() AS CurrentDatabase, 1 AS ProbeSucceeded;"How to compare these tools
Test the same address and port from the relevant network. Create a lab transport failure and a separate failed login. Verify the alert distinguishes a reachable port from a successful SQL query. Sources checked .
Separate port reachability from login and a successful SQL query
Connect to the named disposable ConnectivityTrial database with an authorized probe identity. Run the SQL below once as a success control and once with @ForceQueryError set to 1 to exercise the query layer.
Check SQL Server database and simulate a query-layer failure
T-SQL · 9 lines
- Run a successful TCP and SQL probe from the same host. Record hostname, port, driver and database without retaining the password.
- Compare a closed port and a rejected test login. Look for the stage at which the failure occurs. Keep any TLS failure separate from the login case.
- Run the forced query error with a valid login. Compare the SQL client error, exit status and TCP check. Make sure your alert names the failure at the level the probe can detect.
Conclusion
Use a TCP check from the application network to detect a path failure and a SQL query check to confirm the login and database. Keep both checks on the same endpoint and label the probe location. A tenant, app or firewall change is easier to investigate when the alert identifies the exact failed step.
Frequently asked questions
Does an open SQL Server TCP port mean the database is available?
A TCP check confirms that the probe can open a socket to the host and port. Use a SQL Server driver to confirm protocol negotiation, certificate validation, authentication and a successful query in the right database.
Should I always check TCP port 1433 for SQL Server?
Check the configured port for the exact listener or instance your application connects to. TCP 1433 is common for a default instance. Named instances and listener configurations can use another port.
Where should I run a SQL Server connectivity check?
Run it from the application host, or from a probe with the same relevant DNS resolver, routing and firewall path. Verify the application's actual driver and identity separately if the probe uses different credentials.
Can I monitor SQL Server availability using SELECT 1?
Yes, it is a small query for checking that a configured connection opens and executes a statement. Add a check of the database or a known read-only result if reaching the correct database matters.
Why might a connection test pass from one host and fail from another?
The hosts can have different DNS, routes, firewalls, trust stores, drivers or authentication identities. Record the source of the probe and test using the same host name and connection settings as the affected application.
Why use both TCP and SQL probes for a SQL Server endpoint?
The TCP probe shows whether the network can open the socket. The SQL-aware probe also checks connection settings, access to the expected database and successful execution. Comparing both helps locate the failed dependency.